 Artem Voloskovets
⬤ Netflix stock is working through a pullback phase on the monthly timeframe after years of climbing. The technical picture still looks bullish overall, with buyers stepping in around the $75 mark. The chart shows price dipping into a well-defined support area after hitting highs, suggesting this is more about consolidation than a real breakdown.
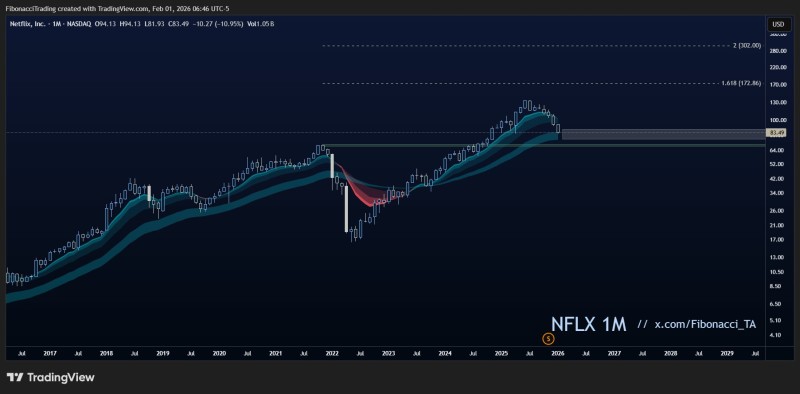
⬤ NFLX is currently trading inside what used to be resistance—now turned support—roughly between the mid-$70s and low-$80s. This zone lines up with earlier price action visible on the monthly candles. Even with an 11% monthly drop, the stock has held above deeper support levels, which keeps the broader uptrend alive.
⬤ The bigger trend still looks healthy. Netflix continues trading above its key rising moving averages, which have caught price during past corrections. Looking back at the chart, similar pullbacks bounced higher once selling dried up near comparable zones. What we're seeing now looks like a breather within an uptrend, not a reversal.
⬤ This matters because Netflix is a major NASDAQ player and a leader in communication services. How price acts around these long-term support zones often shapes how investors feel about growth stocks in general. For now, the chart shows stabilization near an important level, with focus on whether NFLX can defend the $75 area as the longer-term structure plays out.
 Artem Voloskovets


