 Usman Salis
⬤ MicroStrategy's weekly chart is running into trouble because the price sits under the 50-week exponential moving average. A pattern called a falling broadening wedge has formed - the upper edge slopes downward while the lower edge fans outward. This shape tells us price swings are getting wider - yet every rally still dies below the same descending line. Sellers return as soon as the price nears that line - each bounce peaks a little lower than the last.
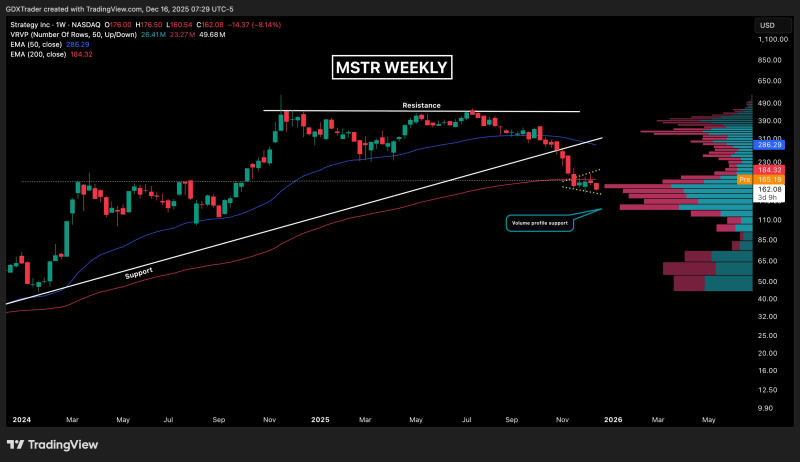
⬤ The 50-week EMA has acted as a lid since the first break below it. Each time buyers lift the price toward that line, supply appears and shoves the quote back down. The widening range between the descending resistance and the rising lower edge of the wedge underlines growing confusion, but downward pressure dominates because demand remains thin.
⬤ Heavy turnover has clustered around the current price band creating a volume profile support shelf. This shelf has slowed the decline for now - yet no sustained rebound has followed. The 200-week EMA also towers above the market, another long term bearish sign. With resistance dropping, volatility stretching and rallies fading, the path of least resistance still points lower.
⬤ MicroStrategy often amplifies changes in risk appetite - its weakness carries weight beyond the single name. When a share lingers beneath its major averages week after week, it signals that buyers lack conviction and sellers retain control. Until the price escapes both the wedge and the 50-week EMA, the odds favor further losses rather than a meaningful advance and the broader trend remains under pressure.
 Usman Salis


