 Saad Ullah

⬤ MicroStrategy shares keep falling, confirming a bearish pattern on the daily chart. After losing a critical horizontal support level late last week, the stock followed up with another down candle, showing that sellers are still running the show. The daily chart matches the broader downtrend we've been tracking, and the pressure stays on as long as price can't get back above key resistance zones.
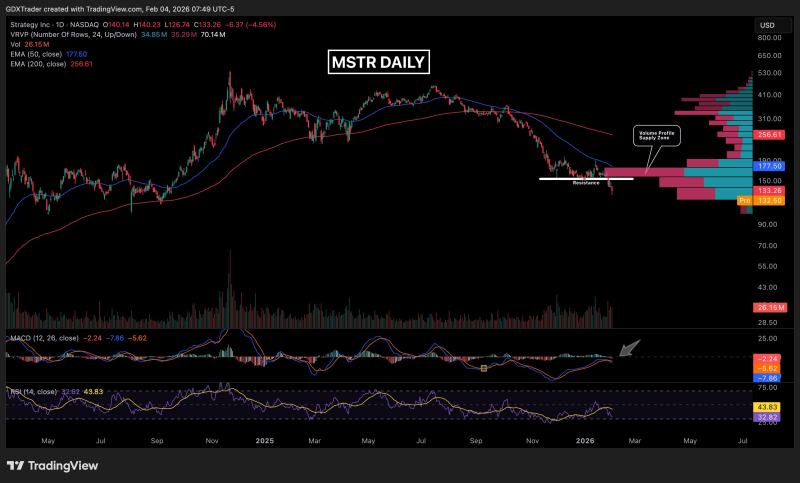
⬤ What used to be support is now acting as resistance, blocking any bounce attempts. Since breaking down, MSTR hasn't shown any real signs of stabilizing or building a base, which tells us selling pressure hasn't let up. There's no consolidation pattern forming, just continued supply hitting the market. The volume profile backs this up too—there's a clear overhead supply zone that's likely to push back against any short-term rallies.
⬤ The momentum indicators are painting the same bearish picture. The MACD crossed below its signal line at the end of last week and has been widening to the downside since then, confirming that negative momentum is building. Meanwhile, the RSI has dropped into the low-30s, showing persistent downside pressure and weak buying interest. Both the 50-day and 200-day moving averages are trending down and sitting above current price, adding another layer of resistance.
⬤ This technical setup matters because it shows how tough it'll be for MSTR to sustain any rallies right now. Even if we see a short-term bottom forming, the combination of overhead supply and declining moving averages creates a challenging environment for bulls. Until MicroStrategy can reclaim that overhead supply zone and get back above at least the 50-day moving average, the technical structure stays bearish. That's shaping expectations around continued volatility and downside risk in the near term.
 Saad Ullah


