 Marina Lyubimova

Here's the thing about Microsoft's recent performance: after eight straight days in the red, the tech giant finally caught a break. This marks MSFT's longest losing streak since 2011, and traders are watching closely to see if this bounce has legs or if it's just a brief pause before more downside.
MSFT Snaps a Historic Losing Streak After Sharp Pullback
Microsoft shares finally found some relief after eight consecutive sessions of losses. The reversal is getting attention as MSFT tries to climb out of a significant technical pullback. The decline was triggered by strong selling pressure near the recent highs around $555, and the chart tells the story pretty clearly.
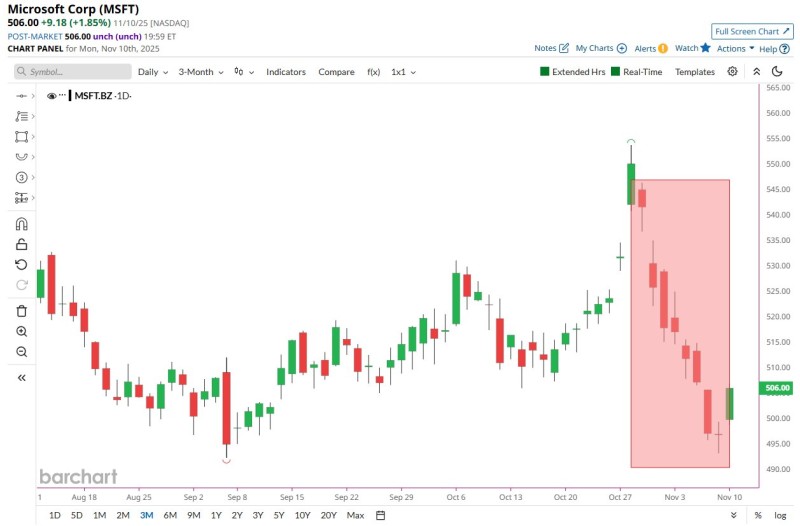
The stock reversed sharply from its late-October peak near $555, where a tall green candle marked the top before sellers took control. What followed was a clean eight-day slide with no real bounces—just consistent downward pressure highlighted by a series of lower highs and lower lows. This wasn't a panic selloff though. The steady candle action with no dramatic volume spikes suggests controlled profit-taking rather than broad capitulation.
MSFT eventually found support in the $495–500 area, where buyers finally stepped in. The final candle in that decline turned green, confirming the streak had ended and pushing the stock back to $506. That bounce happened right at a logical support level formed by previous consolidation from mid-October.
Why Microsoft Declined: Market Drivers Behind the Pullback
Several factors contributed to the extended slide. There's been a broader rotation out of mega-cap tech stocks as investors reassess valuations. Macroeconomic uncertainty hasn't helped either, with traders getting more cautious across the board. MSFT also faced natural profit-taking after hitting that supply zone near $550–555, and sector-wide pressure from muted guidance by other tech leaders added to the downward momentum. These forces combined to amplify the technical rejection that kicked off the eight-day downtrend.
Key MSFT Price Levels to Monitor
- Resistance: $550–555 (primary supply zone), $530 (first bullish target)
- Support: $500 (current base), $485–490 (next level down)
- Trend: Broader uptrend intact; move to $530 signals renewed momentum
What's Next for MSFT?
Microsoft's recovery after an eight-day decline suggests the worst of the selling pressure might be behind us. With the stock holding above $500 and attempting to build a base, the next few sessions will be critical. If MSFT can push past $530, it would confirm buyers are back in control. For now, the technical picture leans cautiously optimistic as the stock works to reclaim higher ground.
 Marina Lyubimova


