 Saad Ullah

⬤ Microsoft is catching eyes in the technical community as the stock appears to have landed on a significant support area on the weekly chart. TrendSpider's analysis shows MSFT has pulled back into what used to be a resistance zone that's now flipped into support—a classic pattern you see in healthy long-term uptrends. The stock is currently trading around $492 as it tests this well-established demand region.
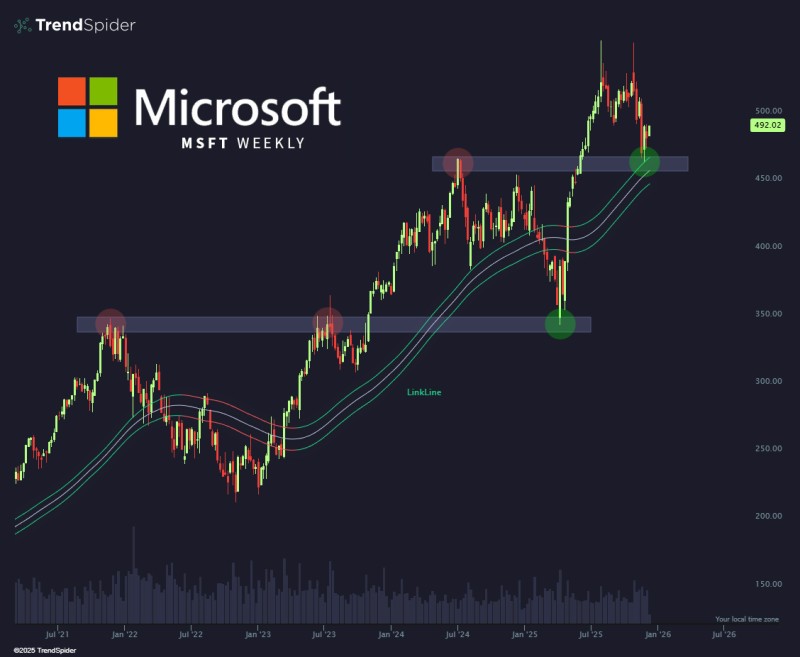
⬤ Looking at the chart history, MSFT ran into heavy resistance multiple times across 2021, 2022, and early 2023 before finally breaking through. Once it cleared those levels, they became solid support floors during pullbacks, and that same dynamic seems to be playing out now. The weekly candles show the stock is trying to find its footing near the mid-$450s, backed up by several moving averages stacking up in that zone. Earlier bounces, including the major rebound from around $350, show a multi-year pattern where Microsoft confirms old ceiling levels as new support before pushing higher again.
⬤ TrendSpider's chart highlights how this isn't a one-off thing—MSFT has repeatedly leaned on these converted levels throughout its climb. The current pullback from the $500 area mirrors past consolidations where the stock paused at key support before regaining momentum. With historical resistance, moving averages, and volume profile all lining up in this zone, the technical case for this support level gets stronger.
⬤ Why does this matter? Microsoft is a heavyweight in major stock indexes, and its chart behavior often influences broader market sentiment. When MSFT successfully defends a major structural level like this, it can signal improving conditions in tech and help gauge overall market risk appetite. Traders are watching closely to see if Microsoft can hold this critical weekly support zone.
 Saad Ullah


