 Saad Ullah
⬤ Microsoft shares have bounced back for now lifting the price to the mid-$490s after weeks of decline. The rebound hints at a pause in the fall - yet the wider trend stays under pressure until buyers push the quote past $500. The daily chart shows the stock climbed away from repeated November and early-December selloffs, though it still moves inside a large correction.
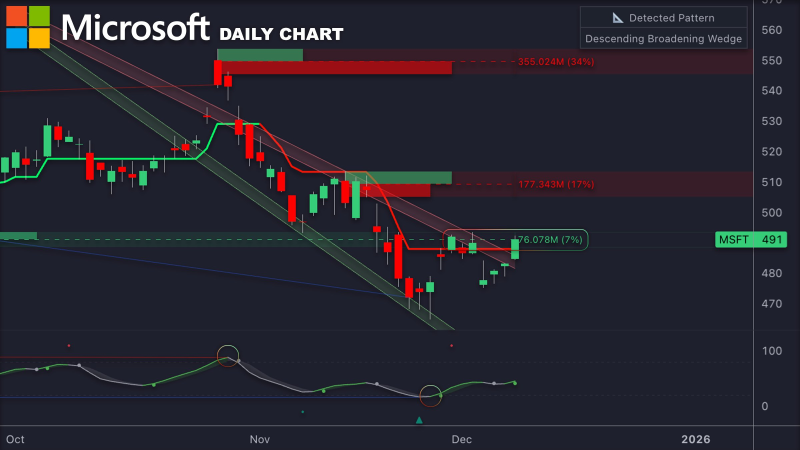
⬤ The chart displays a descending broadening wedge with multiple resistance bands above the current quote. The latest candles reflect fresh demand that carried the price toward the $491 recovery zone. Supply lurks between about $510 and $550; those levels halted earlier rally attempts. The momentum bars at the foot of the chart now point upward - yet they sit below their last cycle highs - traders remain wary.
A close above $500 would mark a structural shift and show strength beyond short term resistance.
⬤ MSFT sits just beneath a group of trendlines that steered the prior decline. A move through $500 would break the wedge's upper border and confirm strength. Until that occurs, the stock stays open to fresh selling because the chart still traces a corrective pattern.
⬤ This bounce carries weight because Microsoft belongs to the heaviest weights in the main U.S. indices - its moves often steer broad market mood. A sustained climb past $500 could steady the wider technology group, while repeated failure beneath resistance may warn that risk appetite stays brittle as the year ends. The price action around this level will set the tone for large cap tech in the weeks ahead.
 Saad Ullah


