Peter Smith

⬤ Microsoft stock is back on track after finding solid footing in a key technical support area. The recent price action shows MSFT responding well to the $293-355 zone on the weekly chart—exactly the kind of spot where buyers typically step in during healthy uptrends.
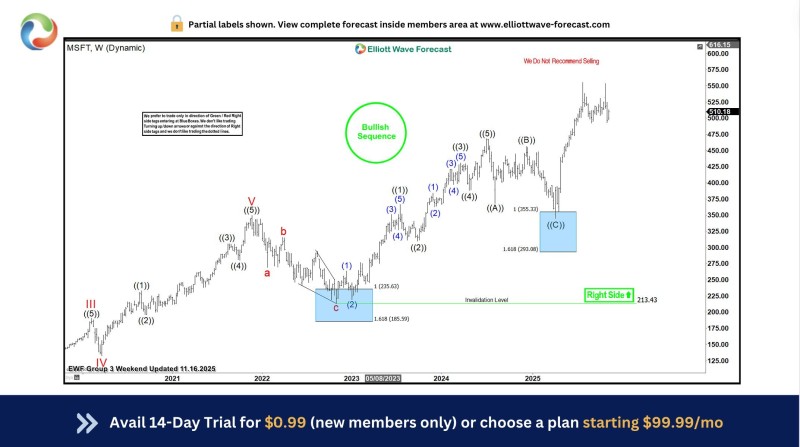
⬤ Here's the thing: the chart paints a pretty clear picture. The major low that formed back in 2023 around $185-236 marked a turning point, and since then, Microsoft has been climbing through a series of strong advances. The latest pullback into that $293-355 blue box zone? It played out just like the pattern suggested—price found support and pushed higher.
⬤ What makes this interesting is how the wave structure keeps pointing up. The chart shows completed corrective phases followed by fresh impulsive moves, which is textbook stuff for continuation patterns. Right now, the setup is eyeing the $510 area as the next major target, and the technical framework suggests there's no structural weakness worth worrying about yet.
⬤ The broader trend remains green, with invalidation levels sitting comfortably below current prices. As long as Microsoft holds above those critical support zones and keeps respecting the bullish sequence, the path of least resistance stays pointed higher. For one of tech's biggest names, that kind of momentum tends to lift sentiment across the entire sector.
 Peter Smith