 Usman Salis

⬤ Microsoft shares hit a critical technical zone on the weekly Elliott Wave chart, sliding right into the blue box area that traders watch for potential turnarounds. Trading near $378, MSFT landed inside the projected support cluster where wave ((C)) is expected to finish. This zone, stretching roughly from $355 down to $293, marks where the corrective phase could wrap up and buying interest typically resurfaces.
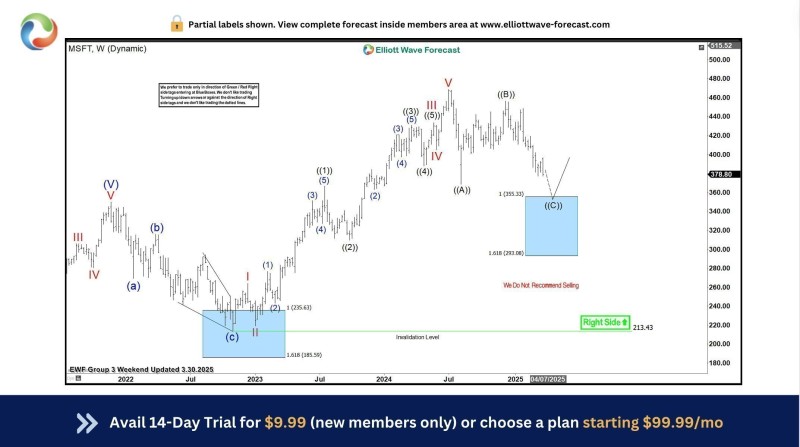
⬤ The chart shows Microsoft wrapped up several upward cycles before shifting into its current pullback. A similar setup played out in early 2023 when the stock bounced hard from a previous blue box zone, adding weight to this technical approach. The wave structure points to fading downside pressure as price approaches the lower end of the target area. With a "Right Side" indicator pointing up, the bias stays bullish as long as Microsoft holds above the key $213 invalidation level.
⬤ What makes this particularly interesting is Microsoft's size and influence across the tech sector. Hitting this Elliott Wave support zone suggests the broader correction might be running out of steam. If historical patterns repeat, MSFT could be gearing up to flip from corrective mode back into upward momentum in the coming months.
 Usman Salis


