 Saad Ullah

Microsoft shares are staging a comeback after finding solid footing in what Elliott Wave analysts call a high-probability reversal zone. The 4-hour chart shows price bounced right where buyers were expected to show up, and that's got traders thinking the correction might be over. If MSFT can keep this energy going over the next few sessions, we could be looking at a return to the uptrend.
MSFT Rebounds From $487-$497 Blue Box Zone
Technical traders noticed MSFT shot higher from the blue box area, putting long positions in a sweet spot with minimal downside risk. The chart shows Microsoft wrapped up an A-B-C correction, with wave C bottoming out right in that Fibonacci sweet spot between $487 and $497.
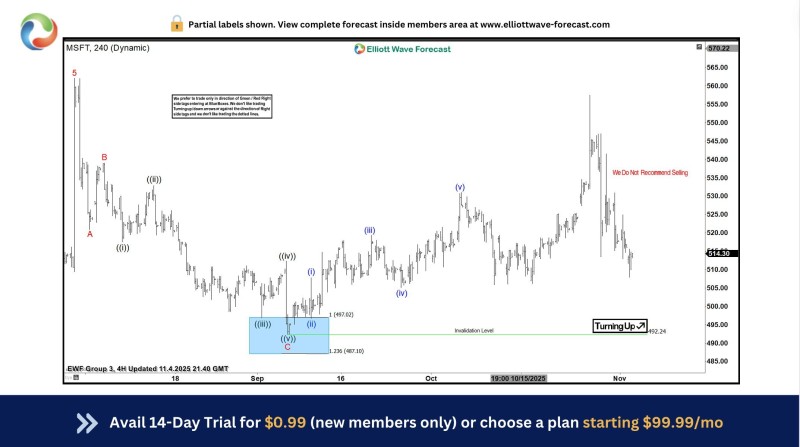
Everything lined up just like Elliott Wave theory predicts: Wave C hit the 1.0 to 1.236 extension target, price stayed above the danger zone, and buyers jumped in immediately after testing support. That's textbook technical behavior.
What the Wave Count Is Telling Us
The chart lays it out pretty clearly: we've got a five-wave rally followed by a clean three-wave pullback. The blue box marks where reversals typically happen, and we're seeing a "Turning Up" signal near $492 that confirms the pivot worked.
After bottoming in early September, MSFT pushed higher in a new impulsive move that confirmed the upward structure through waves (i) and (ii). Sure, it pulled back from that October peak around $570, but the bigger picture still looks solid.
In related AI news, Microsoft has secured U.S. approval to ship Nvidia AI chips to the UAE and is moving forward with a $7.9B infrastructure expansion.
Price Levels That Matter
On the downside, $487-$497 is now confirmed support with $514-$520 providing a backup floor. Looking up, $540-$560 represents the first real resistance zone, while $570 is that previous high everyone's watching.
Volume data suggests there's not much trading happening above current levels, which means if buyers push through, MSFT could run pretty fast through those lighter zones.
 Saad Ullah


