Alex Dudov

Meta Platforms is facing serious selling pressure. The stock has tumbled from its late-summer peak straight into one of the year's most important support zones. The chart tells a clear story: this is a structurally significant move.
META Drops 24% From August Highs, Testing the May Gap Zone
Trader Sven Henrich recently pointed out that META has fallen 24% since August, and the chart backs that up completely. We're seeing a sharp selloff that's pushed the price down to $607. The daily candles show a major downtrend after META couldn't hold above $790–$795.
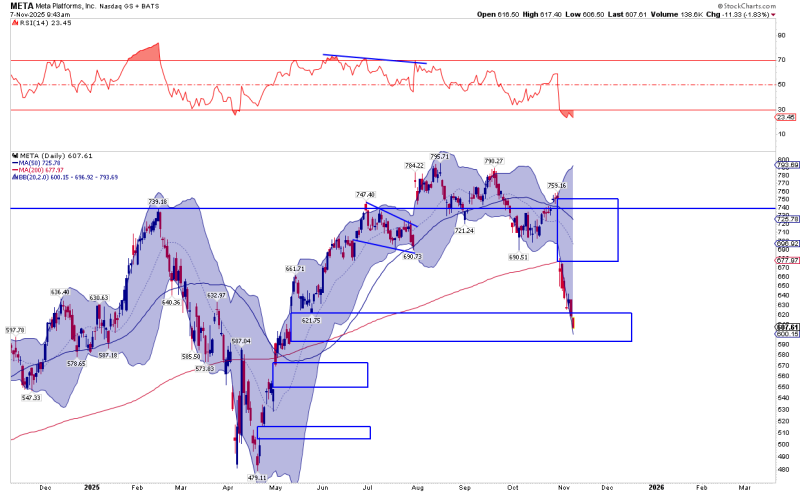
Price has cut through both the 50-day MA at $725 and the 200-day MA around $678, turning both into resistance. The RSI has crashed to 23, putting META deep in oversold territory — we haven't seen it this low since earlier in 2025. The big red candles show heavy selling with barely any recovery attempts. And here's the key: META has dropped straight into that large May gap zone highlighted in blue on the chart, a historical liquidity pocket and potential demand area.
Technical Breakdown: Levels Highlighted on the Chart
META is now dealing with several defined zones. Immediate support sits between $600 and $610 — the stock is just above that level, and losing it could speed up the decline. The primary gap zone from May, spanning $570 to $585, is the main area in play. This is the same zone META pushed through during an earlier rally, and gaps tend to act like magnets. Below that, there's a secondary support cluster between $525 and $550 — the next major level if selling continues. On the upside, overhead resistance sits around $720 to $740, marking META's failed attempt to return to trend before this collapse.
RSI and Bollinger Bands Signal Extreme Conditions
The RSI is in oversold territory, and price has pushed outside the lower Bollinger Band — a combo usually seen during capitulation phases. META has historically responded to setups like this, but oversold doesn't guarantee an immediate bounce.
 Alex Dudov