 Saad Ullah

⬤ Dogecoin is forming the same bullish chart structure that triggered a strong upward move earlier this week. The memecoin has consolidated below a downward-sloping resistance line before breaking sharply higher. The 2-hour chart shows the breakout candle pushing well above the consolidation zone, mirroring an identical pattern from days earlier.
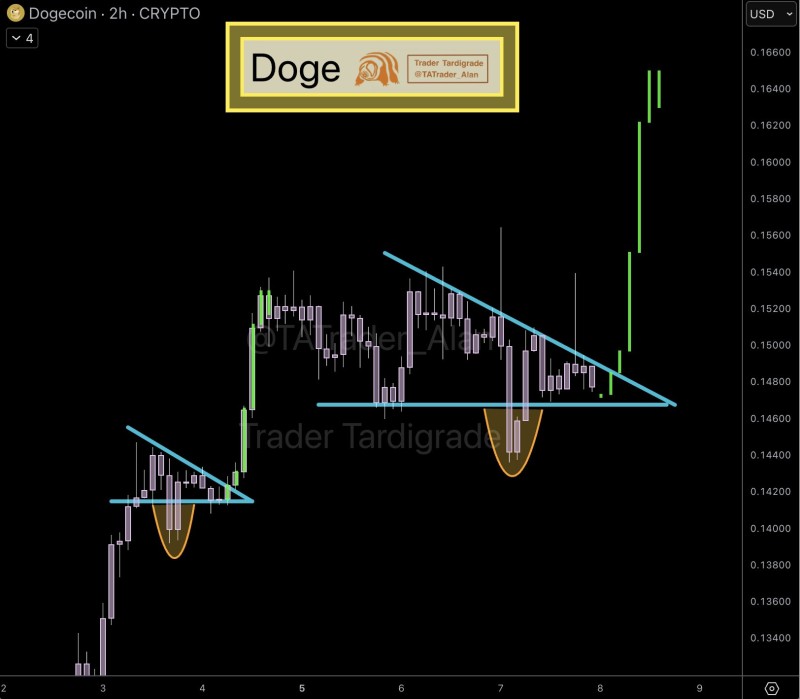
⬤ The setup reveals a technical pattern where DOGE creates rounded bottoms near support before accelerating upward once resistance breaks. Price action ranges between $0.134 and $0.166, with the latest breakout driving Dogecoin toward the upper end. A nearly identical structure earlier this week also sparked a strong rally after price compressed beneath the descending trendline.
⬤ This pattern repetition matters because both breakouts occurred within a short window on the same timeframe, showing consistent short-term market structure. When recognizable formations reappear on widely traded cryptocurrencies like Dogecoin, traders typically watch closely to see if momentum holds or fades. As one of the most actively traded altcoins, DOGE's repeated breakout behavior could shape near-term volatility and directional expectations in the memecoin market.
 Saad Ullah


