Peter Smith

META's recent price action has been anything but predictable. The TrendSpider 1-hour chart shows a clear downtrend taking shape, with each bounce getting rejected at lower highs. For anyone watching META right now, the question isn't if it'll test that gap—it's when.
The Chart Breakdown
Trader John The Rock Trading Co. recently pointed out that the stock's continued weakness is pulling it closer to an unfilled gap around $592—a level that's now less than $30 away.
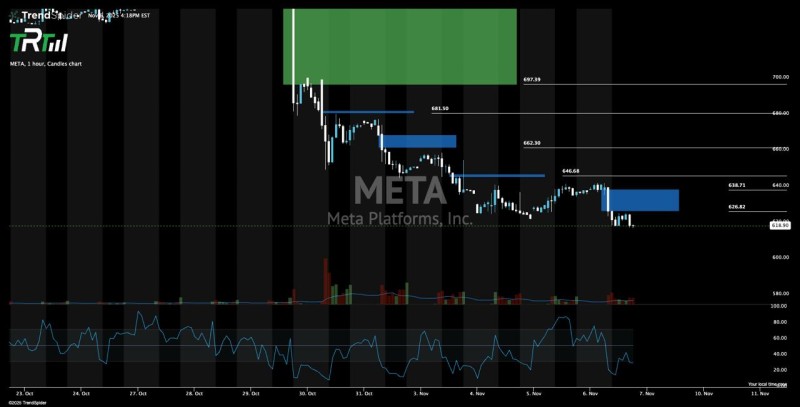
META's technical picture tells a straightforward bearish story:
- Repeated rejections at $646, $662, and $681 have formed a series of lower highs—classic downtrend behavior
- Current price around $618.90 sits just above the $592 gap target
- Blue supply zones on the chart mark areas where support failed and selling accelerated
- Volume spikes are showing up mostly on red candles, confirming aggressive selling
- RSI continues trending lower, signaling fading momentum with no signs of a reversal yet
With each failed bounce, the odds of META drifting down to fill that $592 gap keep increasing—especially during corrective phases like this one.
Why META's Under Pressure
The weakness isn't happening in a vacuum. Rising Treasury yields are pressuring high-valuation tech stocks, and META's heavy AI infrastructure spending has investors questioning near-term returns. Add in some post-earnings profit-taking and broader risk-off sentiment across markets, and you've got a perfect storm for continued downside.
Unless META can push back above $638 and hold it—ideally reclaiming $646—the downtrend stays intact and that $592 gap remains the most likely target. A bounce could materialize near gap support, but only if buyers actually show up with conviction. So far, the chart says they haven't. For now, momentum favors the bears, and traders are positioned accordingly.
 Peter Smith