 Peter Smith

⬤ META is hanging out near a critical technical level right now, with price action stabilizing just above the 200-day moving average on the daily chart. After getting hammered earlier in the period, Meta Platforms bounced back and has settled into a tight consolidation zone around the mid-$660 range. The chart shows a rounded recovery followed by a quick pullback—basically, the early bones of a cup and handle pattern. This positioning near the long-term moving average sets up a potential breakout scenario.
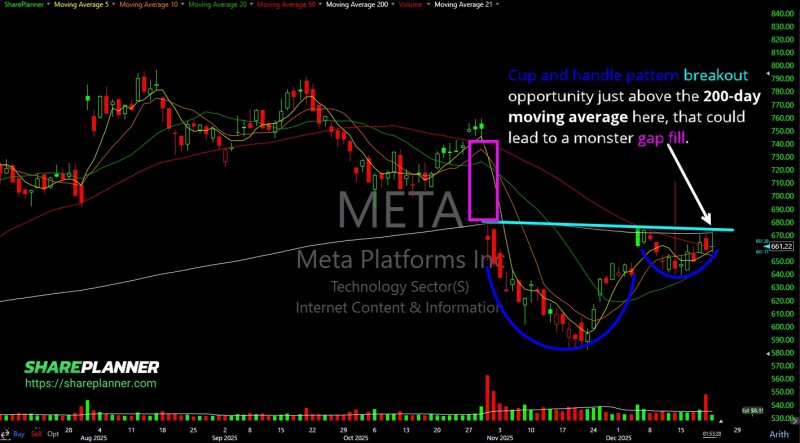
⬤ The earlier selloff in META was pretty brutal—created a noticeable downside gap and pushed the stock well below its longer-term trend before buyers finally showed up. From the lows near the high $500s, the stock climbed steadily back toward the 200-day moving average, which is now acting as a key support-turned-resistance level. The handle part of the pattern is forming as price takes a breather below nearby resistance, suggesting selling pressure has cooled off compared to the earlier drop.
⬤ The chart also flags an overhead gap area that could become relevant if META pushes higher from here. Resistance is stacked just above the 200-day moving average, roughly in the $670 to $680 zone—that's the level that needs to get cleared for pattern confirmation. Until that happens, META is stuck in a technically sensitive range where consolidation might continue as the stock tests this long-term indicator.
⬤ Why does this setup matter? META's moves around the 200-day moving average tend to ripple across large-cap tech stocks and influence broader sentiment. A clean break above this level could signal improving technical conditions after recent volatility, while failing to hold above it might delay further upside. Right now, Meta Platforms is sitting at a crossroads, and how it handles this widely watched trend benchmark could set the tone for what comes next.
 Peter Smith


