 Victoria Bazir

⬤ Meta Platforms META has jumped more than 13 percent after a weekly TD indicator flashed a buy signal. The reversal came after several weeks of decline, with the latest candle closing near 673 dollars and showing strong recovery momentum. META bounced from recent lows and reclaimed key technical zones as market sentiment shifted positive.
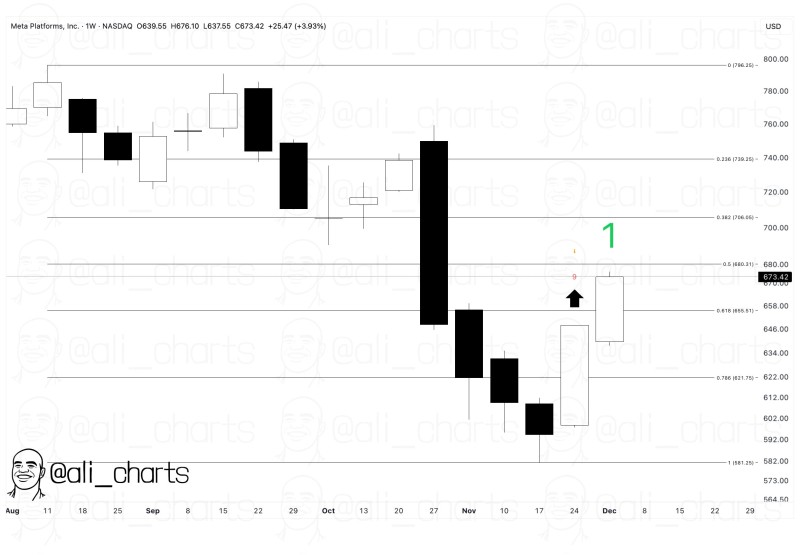
⬤ The chart shows META traded between 639 and 676 dollars during the week, settling around 673 dollars for a 3.93 percent weekly gain. This follows intense selling that drove the stock down to a cycle low near 581 dollars before finding support. The TD buy signal on the weekly timeframe matched the turnaround perfectly, and the latest candle broke through multiple short term resistance areas. The next major target sits at 700 dollars, where traders will test whether this recovery has legs.
⬤ META also recaptured ground around the 0.618 Fibonacci level near 655 dollars before accelerating higher. The large white candle marks a clear shift in market behavior after weeks of red. The chart's annotations highlight 700 dollars as the defining zone ahead, mapping out the technical path forward.
⬤ This matters because META drives sentiment across the broader tech sector. A push toward 700 dollars would strengthen confidence in the recovery trend, while a stall near that level could signal the market needs time to digest the rapid bounce. META's moves often ripple through large cap tech stocks and shape expectations for Nasdaq performance.
 Victoria Bazir


