 Victoria Bazir

⬤ Meta Platforms is showing signs of recovery after weeks of decline, with attention focused on a critical support zone on the weekly chart. Traders are debating whether META can hold this trend-line support and make a run toward $850. The chart reveals META trading within a multi-year ascending channel, with the recent pullback bringing the stock back to the channel's lower boundary.
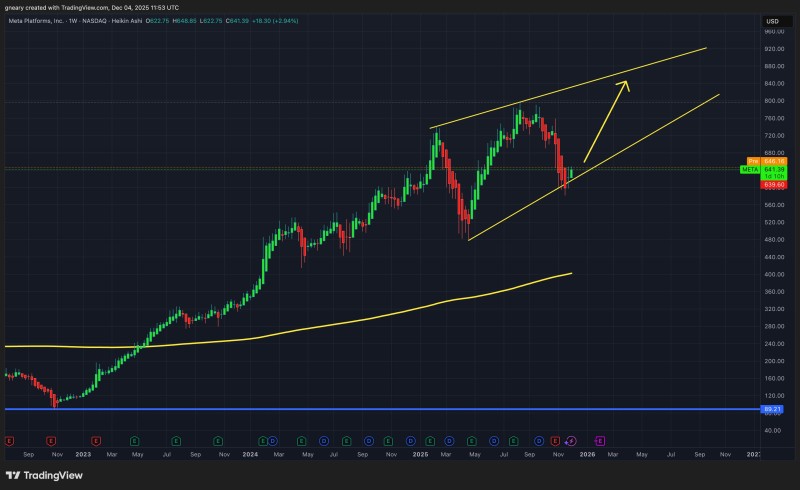
⬤ Despite recent volatility, META's long-term uptrend remains intact. Price action has bounced between the rising channel lines, with the latest correction forming a series of lower weekly candles before finding support around the mid-$640 range. The chart suggests buyers are stepping in to defend the trend line—a pattern seen in previous rebounds. If momentum builds, the path toward $850 opens up.
⬤ The $850 target matches resistance zones from earlier rallies, and the channel structure indicates room for further upside if market conditions cooperate. Right now, the focus is whether META can stay above this rising support. Holding here would confirm the uptrend is still alive, while a breakdown could signal a shift to a more neutral phase.
⬤ META's price action carries weight beyond its own chart. As one of the market's most influential tech giants, META's performance often reflects broader risk appetite and sector sentiment. The current technical setup offers valuable insight into trend strength, potential rotation patterns, and the health of the wider market.
 Victoria Bazir


