 Peter Smith

⬤ Meta Platforms (META) is back in the spotlight after a revenue-to-valuation comparison started making rounds. According to @TrendSpider, Meta's pulling in roughly $190 billion annually while carrying a market cap around $1.6 trillion—numbers that are fueling fresh debates about how Wall Street prices big tech right now. The chart shows META trading near $650, riding a long-term uptrend that started after the brutal reset in late 2022.
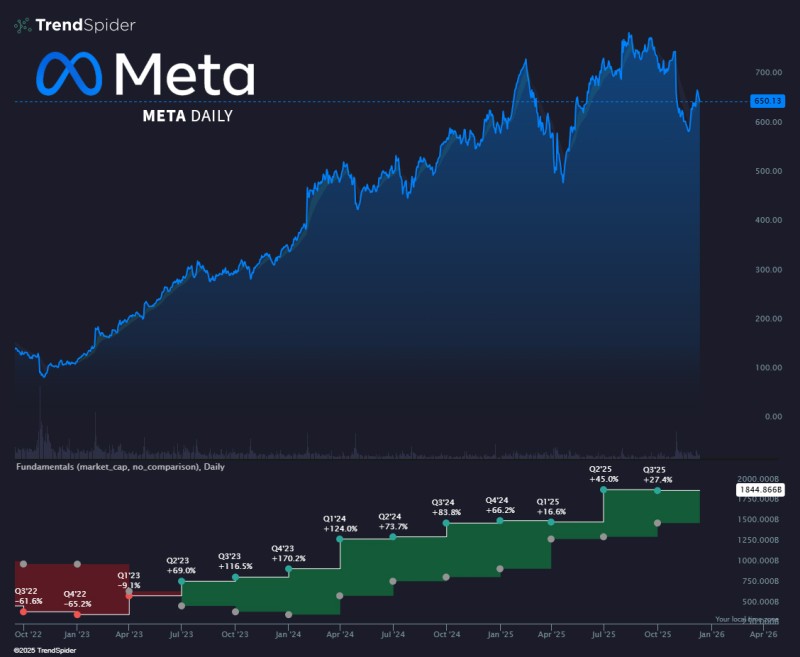
⬤ The data paints a picture of one hell of a recovery through 2023 and 2024. The stock climbed from under $100 to over $700 before cooling off a bit. Market cap movement in the lower panel shows the sharp reversal after the Q3 and Q4 2022 collapse. What followed was explosive—69% gain in Q2 2023, a 170.2% surge in Q4 2023, then strong momentum into 2024 with quarterly jumps like 124% in Q1 and 83.8% in Q3. By late 2025, the chart shows Meta pushing toward approximately $1.84 trillion in valuation.
⬤ The original post threw in a SpaceX comparison—$15 billion in revenue matching a $1.5 trillion private market valuation. While it's partly tongue-in-cheek, the contrast shows just how massive Meta's scale really is and highlights the wider conversation about revenue multiples across public and private tech players. The multi-year chart drive home how dramatically Meta's market position has shifted since that 2022 downturn.
⬤ Why it matters: Meta's valuation moves ripple through the whole megacap tech sector given its weight. The expansion shown in these charts keeps the debate alive about how high-growth tech companies get priced against their revenue, and how those benchmarks might influence expectations for both public giants and high-profile private companies.
 Peter Smith


