 Peter Smith
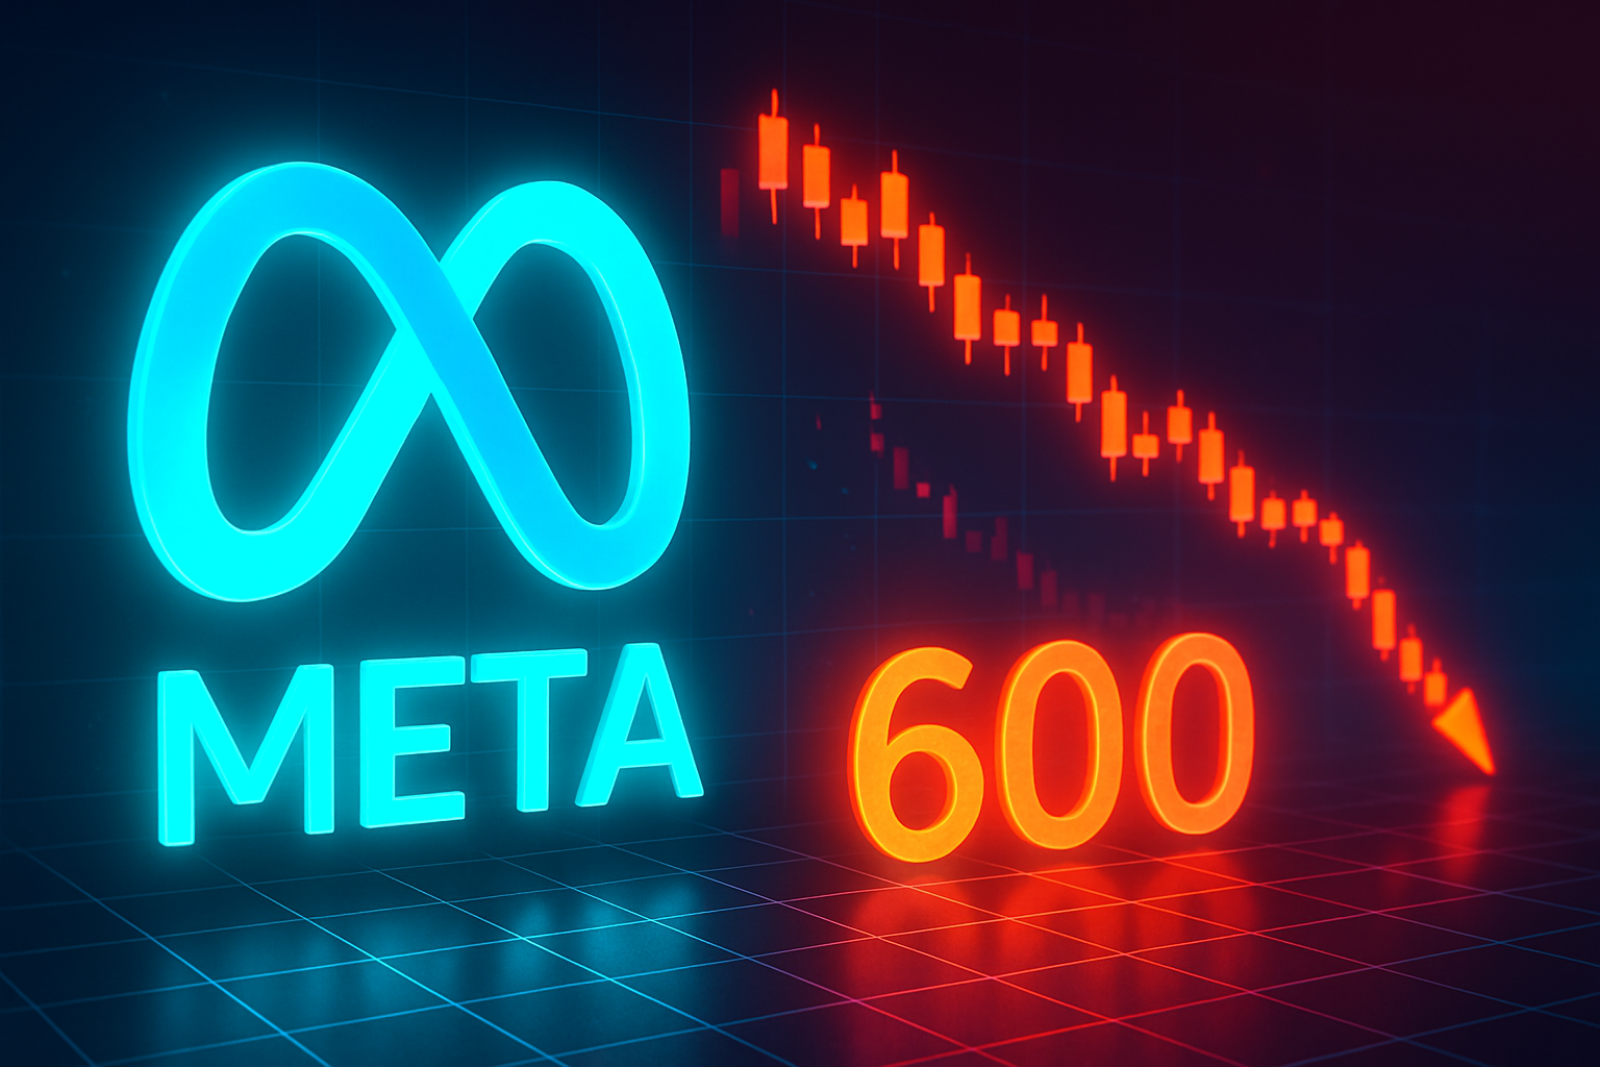
⬤ Meta is under serious pressure right now, showing its worst relative performance against the S&P 500 since 2022. The stock is pulling back toward the 0.618 Fibonacci retracement level around $600, having dropped sharply from recent highs near $790. Weekly candles are pointing decidedly lower, and the momentum isn't looking good.
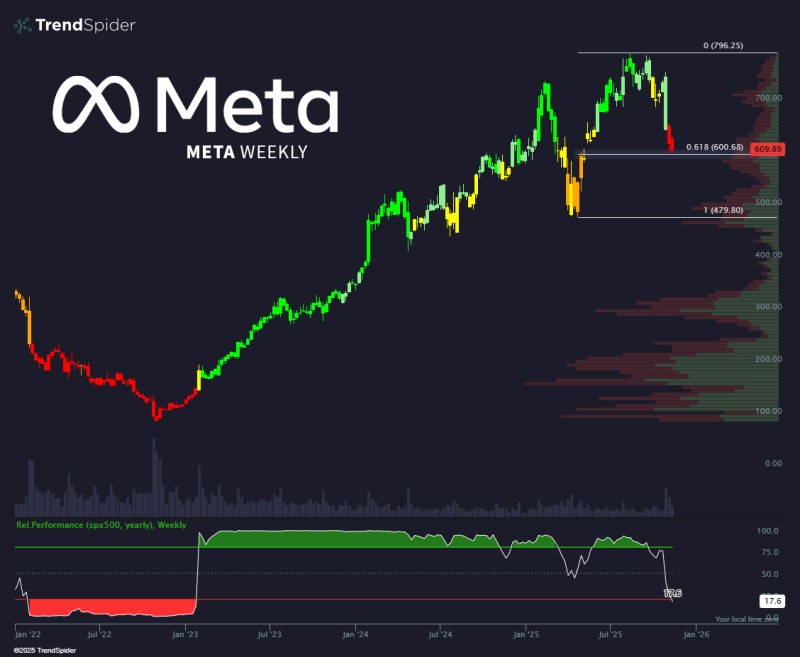
⬤ The $600 level is the line in the sand. If it doesn't hold, the next major support sits down at the April lows around $480—a significant drop from here. The chart shows diminishing support between $600 and those April lows, based on the volume profile, which suggests there may not be much to catch the stock if it breaks down.
⬤ Meta's relative weakness compared to the broader market is particularly notable. It's underperforming at levels not seen in over two years, and the technical picture is deteriorating. The question now is whether buyers will step in at $600 or if this becomes the start of a deeper correction.
⬤ For investors, $600 is the make-or-break level. A bounce from here could restore some confidence and stabilize the stock. But a breakdown would likely confirm that Meta is in for a prolonged period of weakness—and could send ripples through the broader tech sector. The next few sessions around this support zone will be critical.
 Peter Smith


