 Usman Salis
⬤ Meta Platforms is showing a solid bounce from a major support zone in the latest Elliott Wave structure. $META turned upward after reaching the Blue Box area between approximately $653.81 and $588.55, where corrections are expected to complete. The chart shows META testing this projected support range before pivoting higher, suggesting the market has entered what traders call a risk-free phase for long positions.
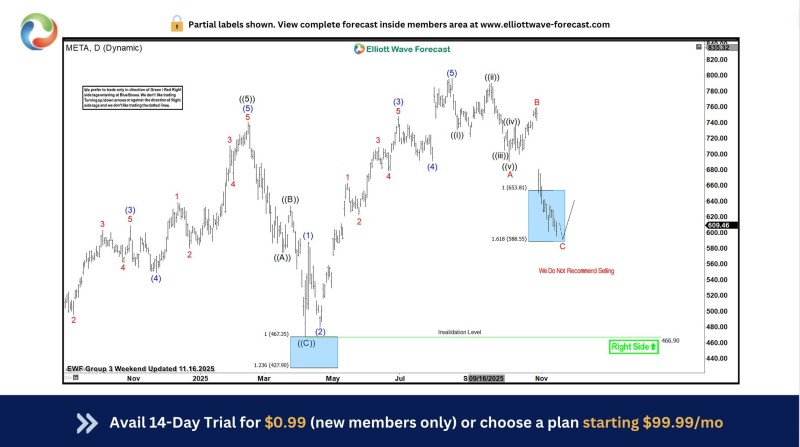
⬤ The chart shows a completed five-wave advance earlier in 2025, followed by a complex correction with W, X and Y structures. The final C-leg decline brought META straight into the Blue Box, which comes from Fibonacci extension measurements. The 1.0 extension sits near $653.81 and the 1.618 projection near $588.55, narrowing where the correction should finish. The latest candles show an initial upward move from this zone.
⬤ Earlier 2025 corrections also ended in similar Blue Box areas, including the prior low near $467.35 and the deeper projection at $427.90. These past reactions show how META has repeatedly respected Fibonacci-based regions within this Elliott Wave framework. META is now trading near $609.46, signaling that price has lifted off support and may be forming the early stages of the next upward leg.
⬤ META's consistent responses to Fibonacci support zones help shape expectations about where the broader trend is heading. The bounce from the current Blue Box mirrors previous corrective phases and shows how the forecast model anticipates upside resolution. As META holds above this zone, traders are watching whether momentum can build into the next phase of the cycle.
⬤ Fresh AI News notes that Meta’s stock is gaining additional traction as new AI-driven revenue streams accelerate toward the projected $199B mark in 2025, reinforcing the bullish rebound from the support zone.
 Usman Salis


