 Saad Ullah

⬤ Iris Energy (IREN) is holding firm above a critical support level near $39, showing a clear double bottom pattern on the weekly chart. Despite ongoing weakness across growth stocks, the price hasn't closed below this support zone on a weekly basis. However, an active sell signal remains in place, meaning the broader trend hasn't fully turned around yet.
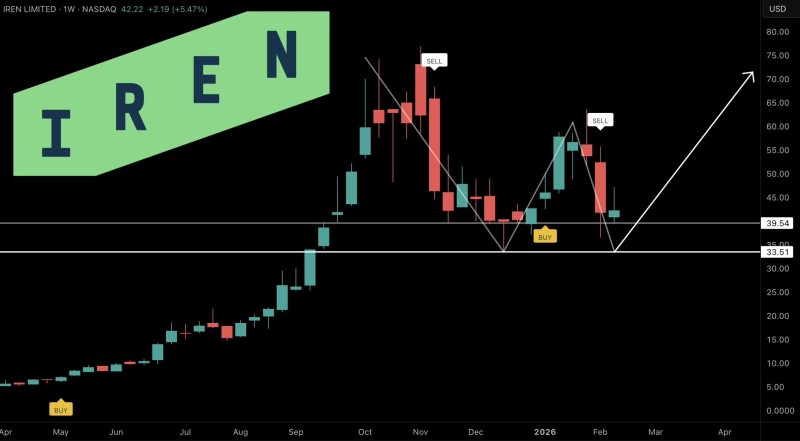
⬤ Right now, IREN is consolidating rather than breaking out. After a sharp drop, the stock formed higher lows around the support area and bounced toward resistance levels at $45 and $50. A higher resistance zone sits near $60, which lines up with projected upside targets shown on the chart. According to market analysts, a fresh buy signal could emerge once the tech sector's volatility cools down.
⬤ The technical picture suggests IREN is attempting to recover, but it's not a confirmed breakout yet. Staying above the base shows that selling pressure is easing, but we'll need to see the weekly timeframe shift from sell to buy conditions for real confirmation. If the recovery gains traction, IREN could eventually push toward the $100+ range during a stronger bullish phase.
⬤ IREN's chart structure reflects broader sentiment in infrastructure and high-growth tech stocks. Holding above support signals that risk appetite is stabilizing, while a break below the base would point to renewed downside pressure across similar names. This pattern represents a key inflection point—either the correction continues, or we're entering a gradual recovery phase.
 Saad Ullah


