 Saad Ullah

⬤ Iris Energy Limited (IREN) stabilized in the latest session, closing near $53 after pulling back from recent highs. The stock retested its bull market support band and managed to finish above the 20-day simple moving average. Price action held near the mid-range of the Bollinger Bands, showing buyers stepped in at key support levels.
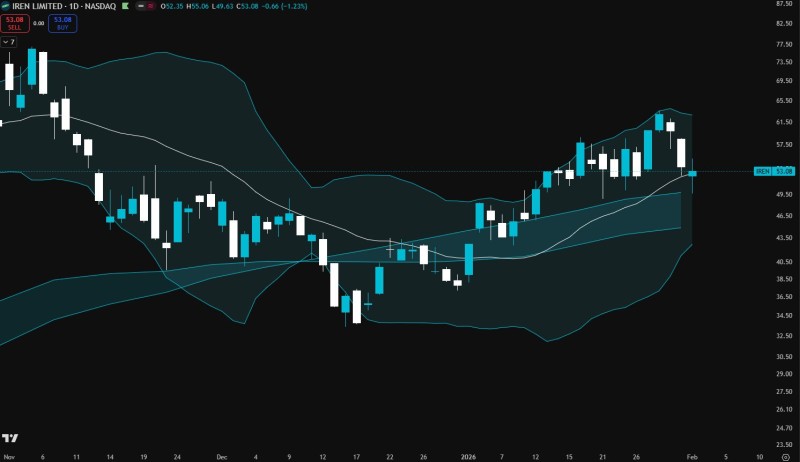
⬤ Before this dip, IREN had been climbing from December lows with rising moving averages backing the trend. The pullback tested the bull market support zone—where multiple trend indicators overlap. Instead of breaking down, the stock bounced and closed above the 20-day SMA, confirming buying interest remains alive at this technical level.
⬤ The chart shows IREN now trading near the middle Bollinger Band rather than the upper extreme from earlier in the rally. This positioning signals cooling momentum without confirming a breakdown. The lower band sits well below current price while the upper band has flattened, pointing to reduced volatility compared to prior sessions.
⬤ This price behavior matters because it tests whether the uptrend can survive a pullback. Holding above the 20-day SMA keeps the structure intact for bulls, while dropping below could trigger deeper consolidation. With IREN sitting at this widely-watched technical level, the next few sessions should reveal whether buyers have enough strength to push higher or if bears will take control.
 Saad Ullah


