 Victoria Bazir

⬤ IREN shares pushed higher recently, riding a recovery wave that's been building after months of sideways action. The stock's hovering around $50 now, showing renewed strength after a lengthy correction. Traders are zeroing in on momentum indicators that look a lot like they did during the last big rally.
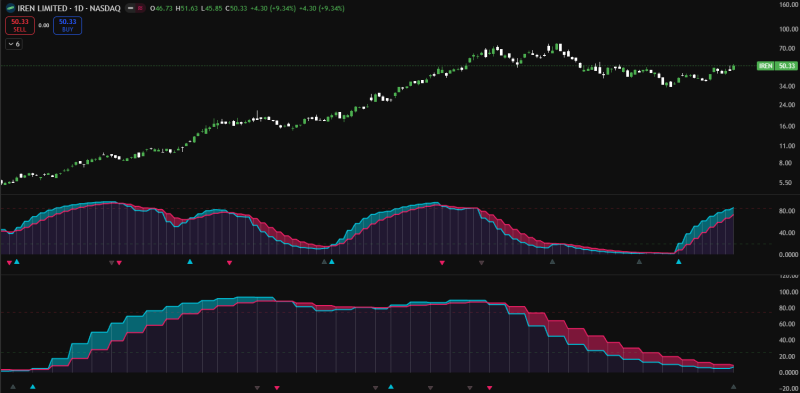
⬤ The chart tells an interesting story. IREN rocketed from the $5–$6 zone all the way to $70 before hitting the brakes. After that climb, the stock went through a long pullback that eventually turned into consolidation, with price quietly building higher lows. The latest session saw a solid 9%+ jump—clear evidence buyers are back in the game.
⬤ What's catching attention now are the momentum readings. The slow stochastic is curling upward from lower levels and looks ready for a bullish crossover. Last time this setup appeared, IREN launched into a major uptrend. Nobody's saying history will repeat exactly, but the current technical picture shows building strength rather than fading momentum.
⬤ This matters because IREN tends to make sharp moves when momentum conditions line up right. Better technical signals often bring more volatility and trading action, especially if price stays above recent support zones. For now, IREN's in an active upswing with technicals playing a key role in what happens next.
 Victoria Bazir


