 Marina Lyubimova

⬤ Iris Energy shares, trading as IREN on the Nasdaq, have turned higher after a sharp pullback. The daily chart shows IREN rebounding toward the high $40 area following a correction phase. Some traders have labeled the chart as bearish, but others argue this view misses the bigger technical picture and needs closer examination.
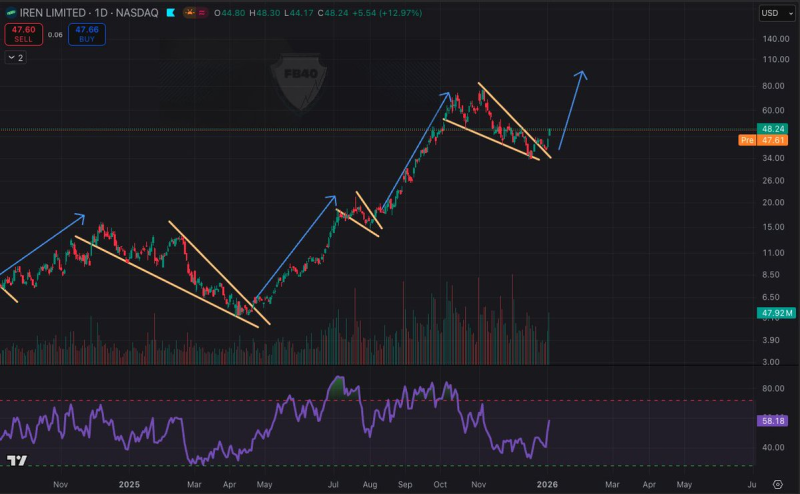
⬤ The chart reveals a repeating pattern over recent months. Each strong rally in Iris Energy gets followed by a downward-sloping consolidation that looks like a falling wedge. Blue arrows mark the explosive moves up, while orange trendlines trace the pullback phases. In the latest cycle, IREN declined in another wedge pattern before reversing higher, with price now climbing from prior lows and trying to resume the uptrend.
⬤ The relative strength indicator at the bottom of the chart shows recovery from weaker levels back toward neutral territory. This setup mirrors earlier phases when Iris Energy shifted from consolidation into upward momentum. The analysis suggests that calling the IREN structure bearish might reflect narrow technical thinking, given the repeated pattern of pullbacks followed by fresh advances.
 Marina Lyubimova


