 Marina Lyubimova
Hims & Hers Health stock demonstrated resilience during a volatile session, catching the attention of technical traders monitoring key support zones. The 14% intraday recovery from session lows has sparked debate about whether this marks the beginning of a trend reversal or simply a temporary bounce in an ongoing correction.
HIMS Recovers 14% After Testing Fibonacci Support
Hims & Hers Health showed impressive strength after climbing roughly 14% from its session lows. The turnaround happened right at the 0.786 Fibonacci retracement level—a technical zone that often attracts buying interest when stocks are oversold.
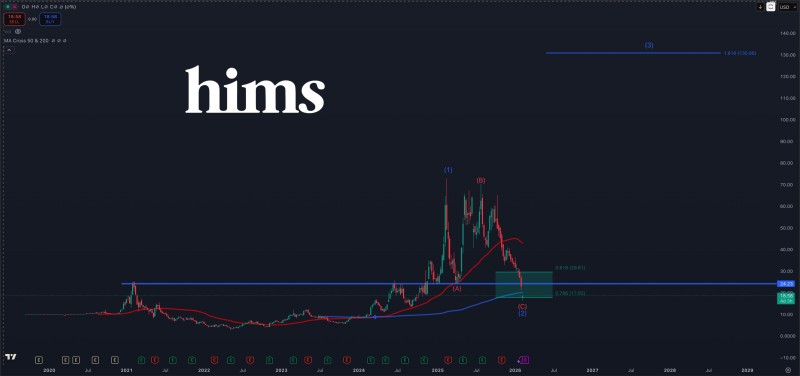
What makes this bounce particularly interesting is its timing. The stock has been sliding for weeks, and this reaction came exactly where technical models predicted support might appear. Traders who follow Fibonacci levels saw this as a textbook setup, though whether it holds remains the million-dollar question.
The chart also points to another critical factor: if HIMS can push higher and fill the open gap above current prices, it would reclaim the 200-week moving average. That's a line in the sand many long-term investors watch closely when judging overall trend health.
Recent Price Action and Support Testing
This isn't the first time HIMS has tested these levels. Recent analysis highlighted how the stock returned to areas that previously acted as breakout zones, as covered in HIMS stock tests critical support. When former resistance turns into support, it can either validate a longer-term uptrend or signal that momentum is fading.
Right now, price behavior suggests the market is undecided. Bulls point to the bounce as proof that buyers are willing to step in. Bears argue it's just a reflex move in a broader downtrend.
Insider Activity Adds Context
While technicals tell one story, ownership trends tell another. Over the past year, company insiders unloaded nearly $190 million worth of shares, and institutional ownership declined as well, detailed in HIMS insiders dump nearly $190M in shares. That kind of selling usually raises eyebrows, especially when paired with a stock testing major support.
The combination of technical bounce and insider exits creates a mixed picture—one that keeps both bulls and bears watching closely.
What Happens Next?
If HIMS manages to close the gap and hold above the 200-week moving average, it would suggest the worst might be over. But if it fails here and rolls back down, the next support zone could be significantly lower. For now, the 14% bounce has given bulls something to work with, but confirmation is still needed.
 Marina Lyubimova


