 Peter Smith
Google's fundamentals are rock solid—no one's arguing that. The stock looks overextended, with technical indicators flashing warning signs that a pullback could be around the corner. RSI divergence and stretched Bollinger Bands suggest Google might be due for a breather after its recent rally. The big question now: will it push through resistance, or is a 5% correction coming this week?
What the Chart Is Saying
Several technical signals are lining up to suggest Google might be running out of steam:
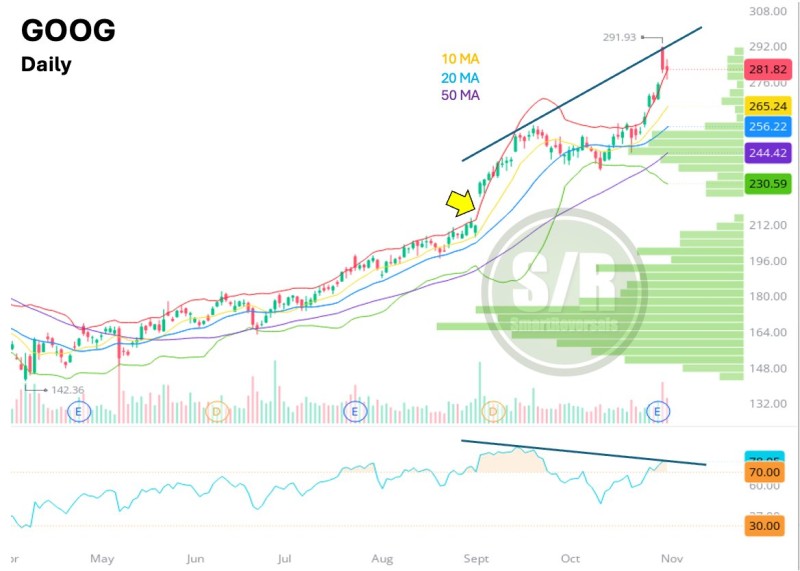
- RSI divergence: While Google's price keeps climbing, the RSI isn't keeping pace—a classic sign that momentum is fading. The RSI recently hit overbought territory near 70, which often triggers profit-taking.
- Bollinger Bands overextension: Google is testing the upper band, meaning it may have risen too fast and could pull back toward the middle band (around the 200-day moving average).
- Volume spikes: Increased buying volume can signal strength, but it can also mean buyers are getting exhausted—setting up potential consolidation or reversal.
- Rising wedge pattern: The price action suggests a wedge formation, which often breaks down if support fails.
- Key levels to watch: Resistance sits at $265, with immediate support at $256. If Google can't break higher, expect a pullback toward $230. A break above $265, though, could open the door to $290.
What's Behind the Technicals?
Google's business is strong, but external pressures are weighing on the stock. Rising interest rates are hitting growth stocks hard, reducing the value of future earnings. After a massive rally, some investors are locking in profits. And with broader market caution, there's been rotation out of tech into more defensive plays—putting pressure on names like Google.
Expects a 5% move this week, but which direction is still up in the air. If Google fails at $265, a drop back to $230 looks likely, especially if the bearish divergence plays out. But if it breaks through resistance and holds, the rally could continue toward $290 or higher. Either way, keep an eye on the RSI, Bollinger Bands, and those key price levels—this week could get volatile.
 Peter Smith


