 Victoria Bazir

⬤ Alphabet (GOOGL) recently declined into a predetermined technical support zone after several weeks of corrective price action. The chart shows price reaching the blue-box demand area spanning roughly $280 to $300, where selling momentum noticeably slowed. This behavior suggests downside pressure may be easing as shares test this key support level.
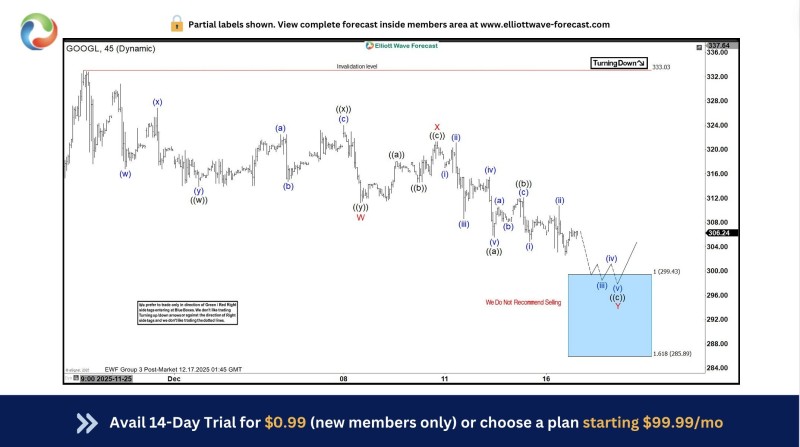
⬤ The pullback played out as expected, with GOOGL entering the highlighted support range on schedule. The chart reveals a completed corrective structure within the broader decline, followed by early reaction signals off the lower boundary. This pattern mirrors previous corrective swings where price paused before attempting recovery moves.
⬤ The technical setup shows a clear downside structure with the invalidation level marked above prior highs. The $280-$300 blue box zone represents a high-probability reaction area based on historical price behavior and wave symmetry. Notably, the chart indicates aggressive selling isn't advisable at these levels, suggesting risk-reward dynamics are shifting as price tests support.
⬤ This matters for broader market sentiment since Alphabet carries significant weight in major equity indices. A successful hold at this support zone could reduce near-term downside volatility and influence related tech stocks. While the larger trend needs confirmation, this technical reaction provides a clear reference point for watching whether price can shift from corrective pressure into recovery mode in upcoming sessions.
 Victoria Bazir


