 Peter Smith

⬤ GOOGL showed a powerful upward reaction after hitting the Blue Box support region on the 4-hour chart, marked between $234-$223. This bounce let long positions move into a safer risk profile as the stock pushed higher from the zone. The chart shows GOOGL stabilizing after finishing a correction phase, with momentum shifting upward from a well-defined demand area.
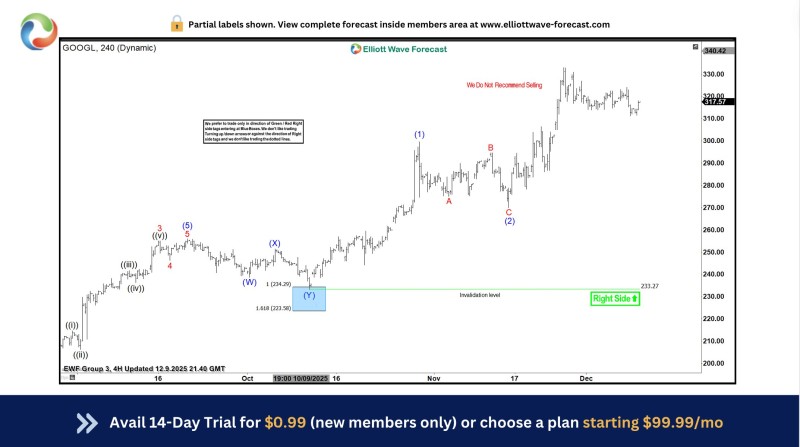
⬤ The Elliott Wave pattern indicates GOOGL completed its correction near the Blue Box before reacting sharply higher, trading near $317 at chart time. The setup includes a right-side directional signal favoring upward movement, with the key invalidation level sitting below approximately $233. The "We Do Not Recommend Selling" notation reinforces the bullish bias and suggests further strength as long as GOOGL holds above these levels.
⬤ The broader picture shows GOOGL maintaining a healthy medium-term trend while prior lows remain intact, and the strong bounce from the Blue Box strengthens the bullish case. The Elliott Wave structure confirms buyers regained control at this technically important zone. With the rebound fitting cleanly into this pattern, traders now have clearer guidance on how GOOGL might move if market conditions stay favorable.
⬤ This reaction matters because it validates the technical significance of the support region and could influence sentiment across major tech stocks. When price responds forcefully from such levels, it typically signals renewed directional confidence and improves the overall trend outlook.
 Peter Smith


