 Victoria Bazir

⬤ GOOG has surged to new highs with strong upward momentum carrying the stock well above its long-term moving averages. The latest weekly chart shows Alphabet's Class C shares accelerating sharply, with the recent candle extending an already steep multi-week climb. Price has rocketed from around $200 earlier this year to above $317, reflecting significant buying pressure. While the technical backdrop shows obvious strength, it also highlights conditions that often come before consolidation periods.
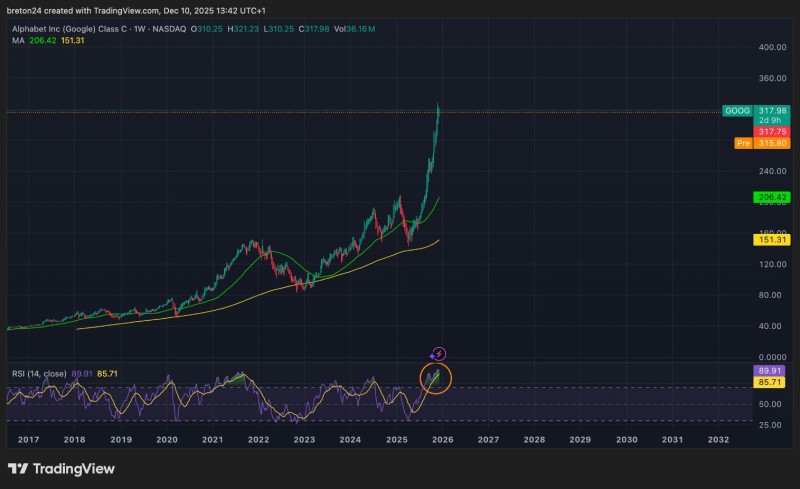
⬤ The weekly RSI now sits near 89, putting GOOG firmly in overbought territory. The indicator has rarely reached such elevated readings in recent years, showing just how rapid the current rally has become. The RSI has been rising right alongside price, mirroring the parabolic move higher. This setup suggests momentum could cool soon, with a pullback becoming more likely if traders start locking in profits at these stretched levels.
⬤ The broader trend structure remains intact despite the overbought readings. Long-term moving averages on the weekly chart near $206 and $151 continue sloping higher, reinforcing the uptrend. But the distance between current prices and these averages is unusually wide, suggesting the stock may need a reset before establishing a more sustainable advance. Waiting for healthier technical conditions may offer a smarter entry point than chasing strength when momentum is at peak levels.
⬤ This matters because GOOG is one of the largest components of major equity indices, and its momentum influences broader market sentiment. Extended technical conditions can bring short-term volatility, especially when large-cap leaders move far ahead of their trend baselines. If GOOG cools off, it could shape wider market dynamics as traders reassess risk appetite and sector positioning.
 Victoria Bazir


