 Eseandre Mordi

⬤ Bitcoin is currently trading near its 730-day simple moving average, a key long-term indicator sitting around $85,180. This level has historically aligned with major shifts in market structure across multiple cycles. The daily chart shows how this moving average has repeatedly emerged as a critical reference point during transition phases in Bitcoin's price history.
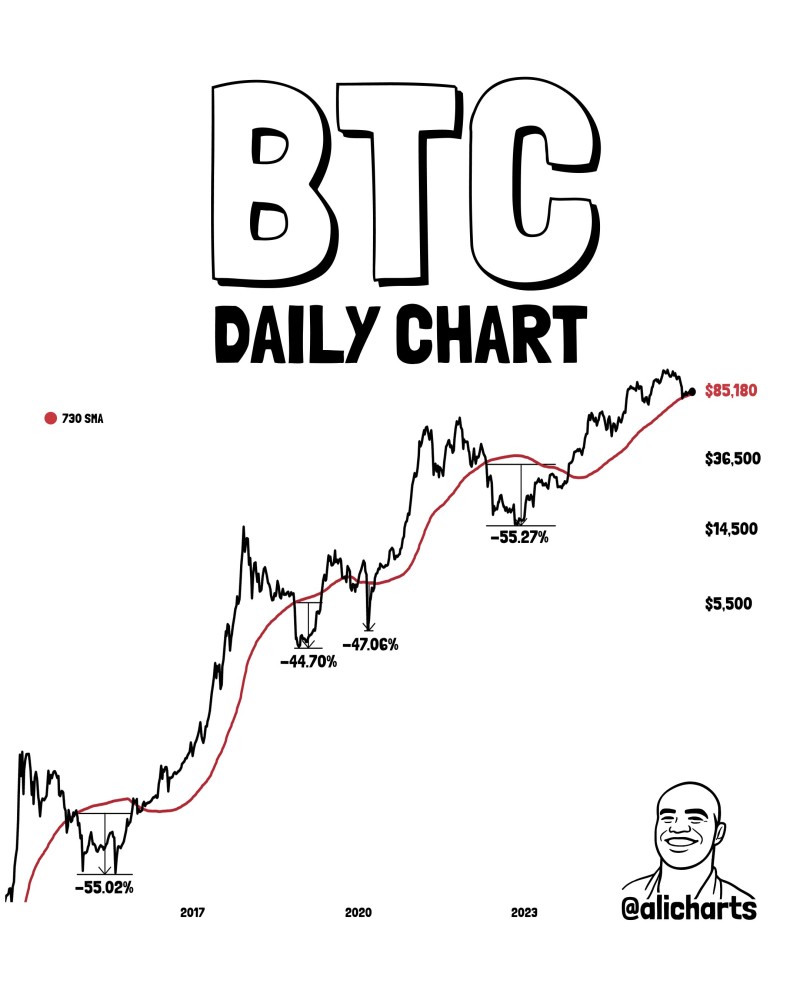
⬤ Looking at Bitcoin's trajectory since 2016, the chart reveals a pattern of strong rallies followed by deep corrections ranging from approximately 44% to 55%. In each case, price eventually found stability around the 730-day SMA. These historical interactions occurred when bearish momentum faded and longer-term direction began to take shape, highlighting the indicator's significance during structural turning points.
⬤ Today's setup looks different from past cycles. Bitcoin has pushed well above previous all-time highs, and the 730-day SMA now sits much higher than in earlier years. Current price action near this level represents consolidation after a multi-year advance rather than recovery from major lows. With BTC trading close to the mid-$80,000 zone, long-term market participants are watching closely to see how price responds to this benchmark.
⬤ Long-term moving averages like the 730-day SMA often serve as critical reference points when markets shift between phases. How Bitcoin behaves around $85,180 could shape expectations about whether the broader uptrend remains intact or whether the market is entering a new adjustment period within the current cycle.
 Eseandre Mordi


