 Marina Lyubimova

⬤ ASML shares are holding strong on the weekly chart, moving inside a well-defined rising channel that's been guiding the stock higher for years now. The price action shows a clear pattern of higher highs and higher lows, keeping the broader bullish structure intact. Based on Elliott Wave analysis, the current setup favors more upside rather than any immediate reversal.
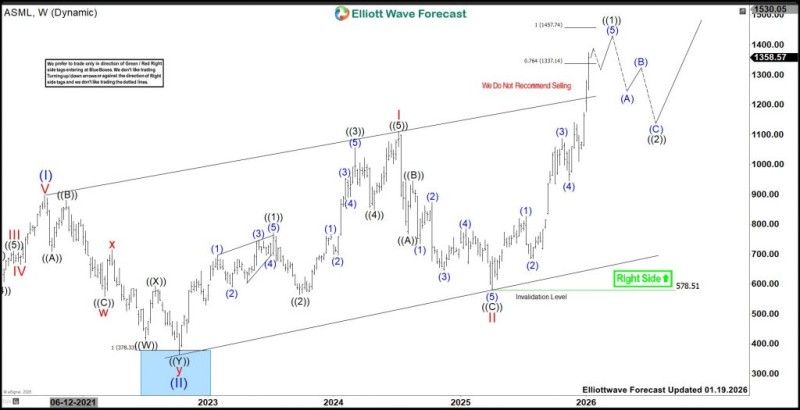
⬤ The Elliott Wave count suggests ASML is pushing through an impulsive phase within a larger trend cycle. Past corrections found support near the lower edge of the rising channel before buyers stepped back in. Since then, price has picked up steam again, showing that demand is still in control. The wave structure points to $1,457.74 as the next meaningful target zone based on typical extension levels.
⬤ The chart also marks important downside levels to watch. If ASML drops below $578.51, the current wave interpretation would no longer be valid. But as long as the stock stays well above that level, the odds continue to favor higher prices. The technical framework suggests selling isn't the play here given how strong the trend remains.
⬤ This outlook matters beyond just ASML since the company sits at the heart of the global chip supply chain. A move toward the $1,457 zone would signal continued strength across the semiconductor sector and confirm the long-term trend is still working. With clear targets, trend direction, and risk levels mapped out, ASML's price movement offers valuable insight into whether this rally has legs.
 Marina Lyubimova


