 Peter Smith

⬤ Apple is attempting to find footing near $272.36 after sliding through December, now testing what could be a support zone while momentum indicators hint at improvement. The stock's getting some traction, and an AI forecast tool is mapping out a possible recovery scenario for the weeks ahead.
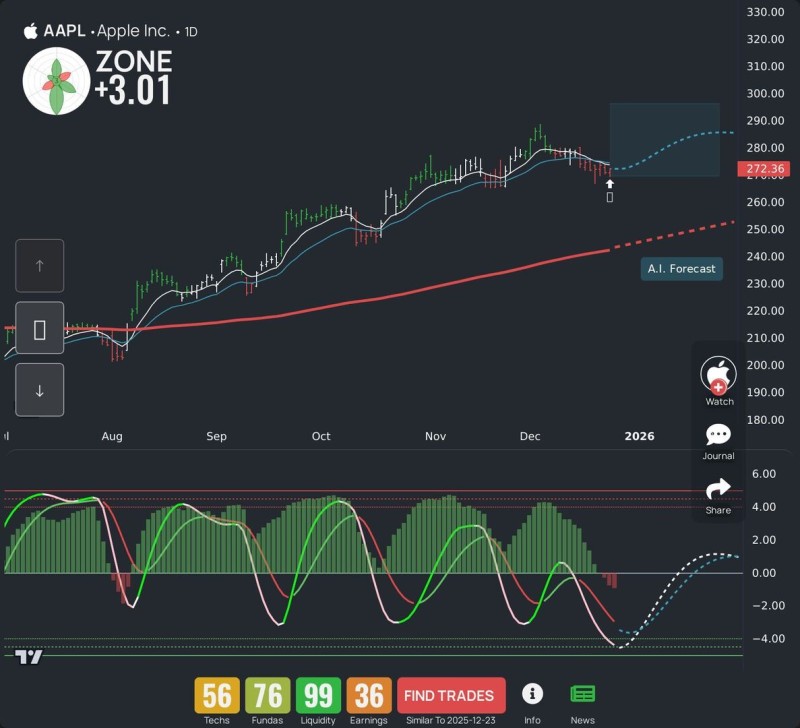
⬤ The chart shows Apple's drop from early December peaks, followed by consolidation around short-term moving averages while staying above the longer red trend line. The AI forecast zone on the right suggests a gradual climb if recent lows hold, while the momentum oscillator below has started turning up from oversold territory—the dotted projection line shows this improvement could continue.
⬤ The technical dashboard displays a "ZONE +3.01" reading along with ratings for liquidity and fundamentals. "The pattern we're seeing could bring swing traders back into AAPL as the technical setup improves," though the stock still sits under the downtrend that formed over the past month.
⬤ What happens with Apple matters beyond just one stock—it's a bellwether for the entire tech sector. If the current level holds and indicators keep improving as shown, it could lift sentiment across mega-cap growth names. But if selling pressure returns, it means Apple hasn't shaken off its correction yet, and caution stays warranted heading into the new year.
 Peter Smith


