 Marina Lyubimova
● In a recent analysis by KPak, Amazon.com (NASDAQ: AMZN) showed a textbook bearish shooting star on its daily chart following a rapid 16% two-day rally. The stock hit intraday highs of $258.60 before closing at $254.00, creating a long upper wick that typically signals buyer exhaustion at all-time highs.
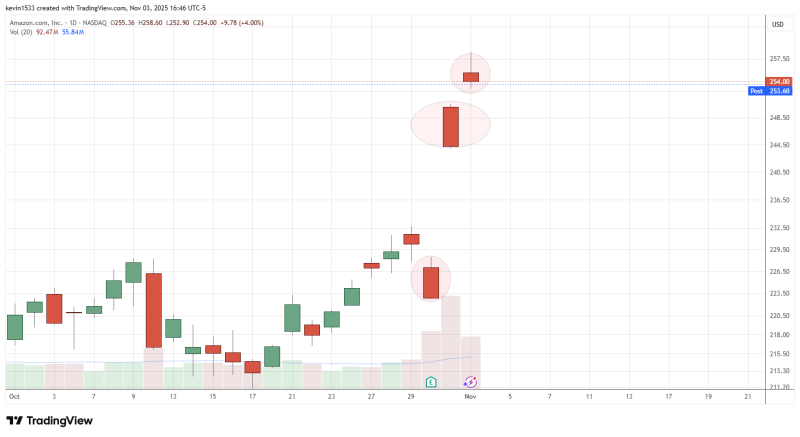
● This pattern appeared after back-to-back gap-ups—a setup commonly seen near short-term peaks when bullish momentum gets overextended. The analyst observed how "the market teaching everyone that a red daily candle close means a huge gap up the next day," referring to traders' recent habit of buying dips aggressively. But these signals often mark reversals as early buyers start taking profits. The stock now faces potential pullback risk toward the $240–$245 support zone if selling picks up.
● While technical patterns don't change Amazon's underlying business, they can shift short-term sentiment. A cooldown period might briefly trim market cap gains after the sharp move. For long-term investors, though, any dip could be a buying opportunity before holiday earnings and continued AWS growth.
● Amazon's rally mirrors the broader tech bounce fueled by AI enthusiasm and strong retail spending. Still, a shooting star at record levels suggests the rally may be running out of steam. Historically, similar patterns on high volume—around 92 million shares here—tend to trigger brief consolidation within days.
 Marina Lyubimova


