Peter Smith

Amazon has climbed over 30% this year, but momentum appears to be fading. Analyst Michael McQuaid has identified a classic head-and-shoulders pattern forming on the daily chart—a technical signal that often precedes trend reversals. This warning comes at a particularly sensitive time, with recent policy uncertainty adding pressure to the tech sector.
Chart Analysis
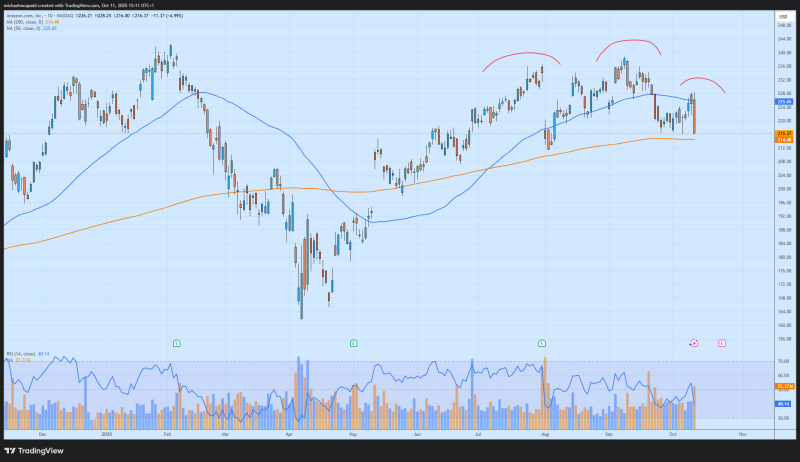
The daily chart shows a textbook head-and-shoulders formation: the left shoulder formed near $242 in early August, the head peaked around $247 in September, and the right shoulder is now struggling near $232, capped below the 50-day moving average at $225.
The crucial neckline sits at $215–$216 and has been tested multiple times. If this support breaks, the bearish pattern would be confirmed, potentially pushing the stock toward $200–$205, close to the 200-day moving average at $214. Recent volume spikes during declines show increased selling pressure, while the RSI at 40 suggests weakening momentum without being oversold yet.
Why It Matters
Trump's economic policies are injecting volatility into big tech. After its year-to-date surge, Amazon's premium valuation makes it vulnerable to corrections. The combination of resistance at the 50-day moving average and fragile neckline support increases reversal risk.
Bulls need to defend the $215 zone. A bounce here, followed by a push above the 50-day average, could restart the uptrend toward new highs. But if the neckline breaks, the bearish pattern will likely take over, pulling the stock lower. Amazon remains a long-term leader in e-commerce and cloud, but for now, $215 is the line in the sand that will determine whether the rally continues or a correction begins.
 Peter Smith