Usman Salis

⬤ AMD completed a double-three correction pattern, landing in a buy zone between $155.28 and $151.14. They stated, "Advanced Micro Devices did a corrective double three correction into the buying equal legs area $155.28 - $151.14 from where a bounce higher was expected to take place." This analysis is driving current attention to whether this support level can trigger the anticipated reversal.
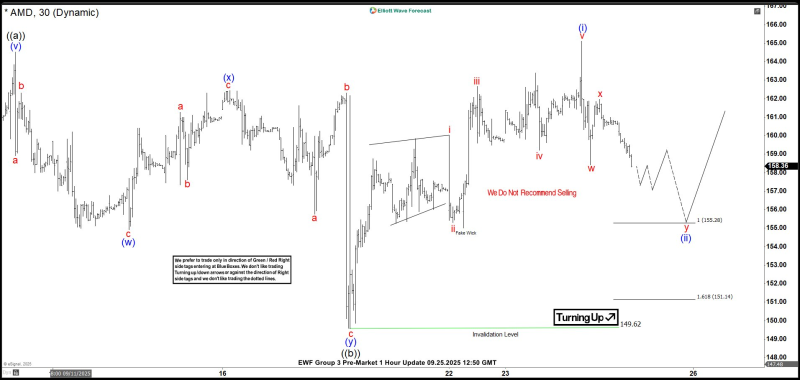
⬤ The technical chart shows AMD's structured W-X-Y decline ending right in the $155–$151 demand zone. The "Turning Up" label suggests the correction may be wrapping up. The earlier rise (marked as waves i through v) indicates the recent drop was likely just a pullback, not the start of a new downtrend.
⬤ The chart explicitly states "We Do Not Recommend Selling," signaling this area is seen as a buying opportunity rather than a danger zone. Current price action around $158 suggests AMD might already be starting to stabilize, matching expectations for an initial bounce.
⬤ Traders are now watching whether AMD can build momentum from this support zone. If the level holds and buying picks up, the Elliott Wave structure points to a potential larger upward move once the corrective wave completes.
 Usman Salis