 Usman Salis
AMD looks like it's hitting its stride. After a period of consolidation, buyers are clearly taking charge, and the technical picture is starting to look pretty compelling.
What the Chart Is Telling Us
A post from Time Traveler Carlssin Trades calling it an "$AMD crystal ball" seems spot-on when you look at the data—buy signals are stacking up, money is flowing in, and momentum is building. The setup suggests there's more room to run.
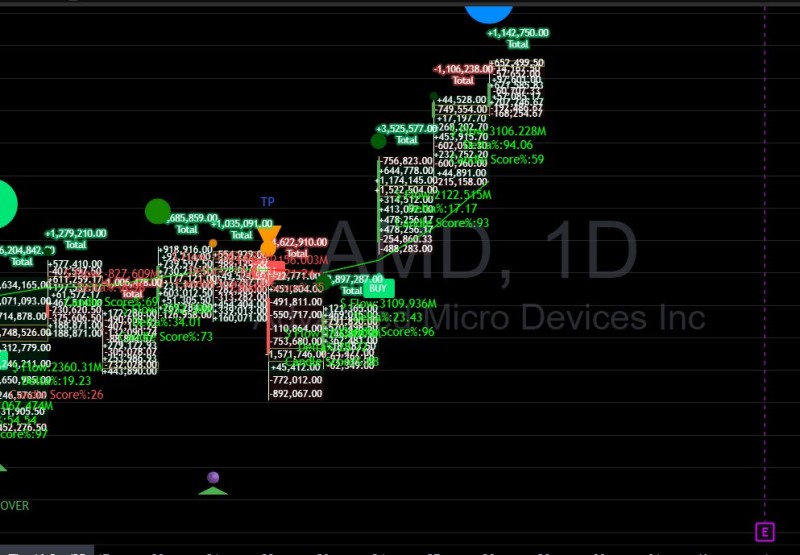
AMD's daily chart paints a clear picture of accumulation. There's a solid stretch of green inflow clusters and strong momentum readings following a brief consolidation phase. A "BUY" signal popped up, then the stock rallied hard—backed by multiple green bubbles showing heavy inflows, some topping $3 million in volume.
You can also spot a "Take Profit" marker above an earlier accumulation zone, meaning a previous bullish target got hit. But here's the thing: buying pressure hasn't let up. That tells you traders still see upside ahead.
The chart is loaded with green inflow readings scoring above 90, which usually signals institutional money piling in. When big players are adding to positions during a trend like this, it's worth paying attention.
Here's what stands out technically:
- Consistent uptrend structure – AMD keeps making higher highs and higher lows, textbook bullish behavior
- Volume surge – The shift from scattered red (selling) to dense green (buying) bubbles shows growing participation and capital flowing in
- Solid base formation – The support zone from earlier has held strong, with fresh inflows stacking on top, turning old resistance into new support
- Rising momentum cluster – Recent momentum readings are climbing, confirming the trend has legs
This whole sequence—from the buy signal to sustained inflows and momentum buildup—looks like a classic acceleration pattern.
Why AMD's Setup Looks Strong
AMD's technical strength isn't happening in a vacuum. A few fundamental drivers are helping fuel the rally:
- AI chip momentum – The MI300 series is gaining real traction in AI data centers, putting AMD in more direct competition with NVIDIA
- Sector recovery – Demand for GPUs and high-end processors is bouncing back as supply chain issues ease
- Institutional interest – Big money is rotating into profitable tech names, and AMD fits the bill
These broader trends back up what the chart is saying, making AMD's setup one of the cleaner ones in large-cap tech right now.
AMD's chart lines up nicely with "crystal ball" optimism. The move from mixed activity to dominant green inflows, paired with consistently high scores, points to more upside potential.
If the buying keeps up, AMD could be eyeing a new resistance zone around $125–$130—another leg higher in what's shaping up to be a solid bullish run. When technicals and fundamentals align like this, the chart really does start to look like a crystal ball.
 Usman Salis


