 Artem Voloskovets

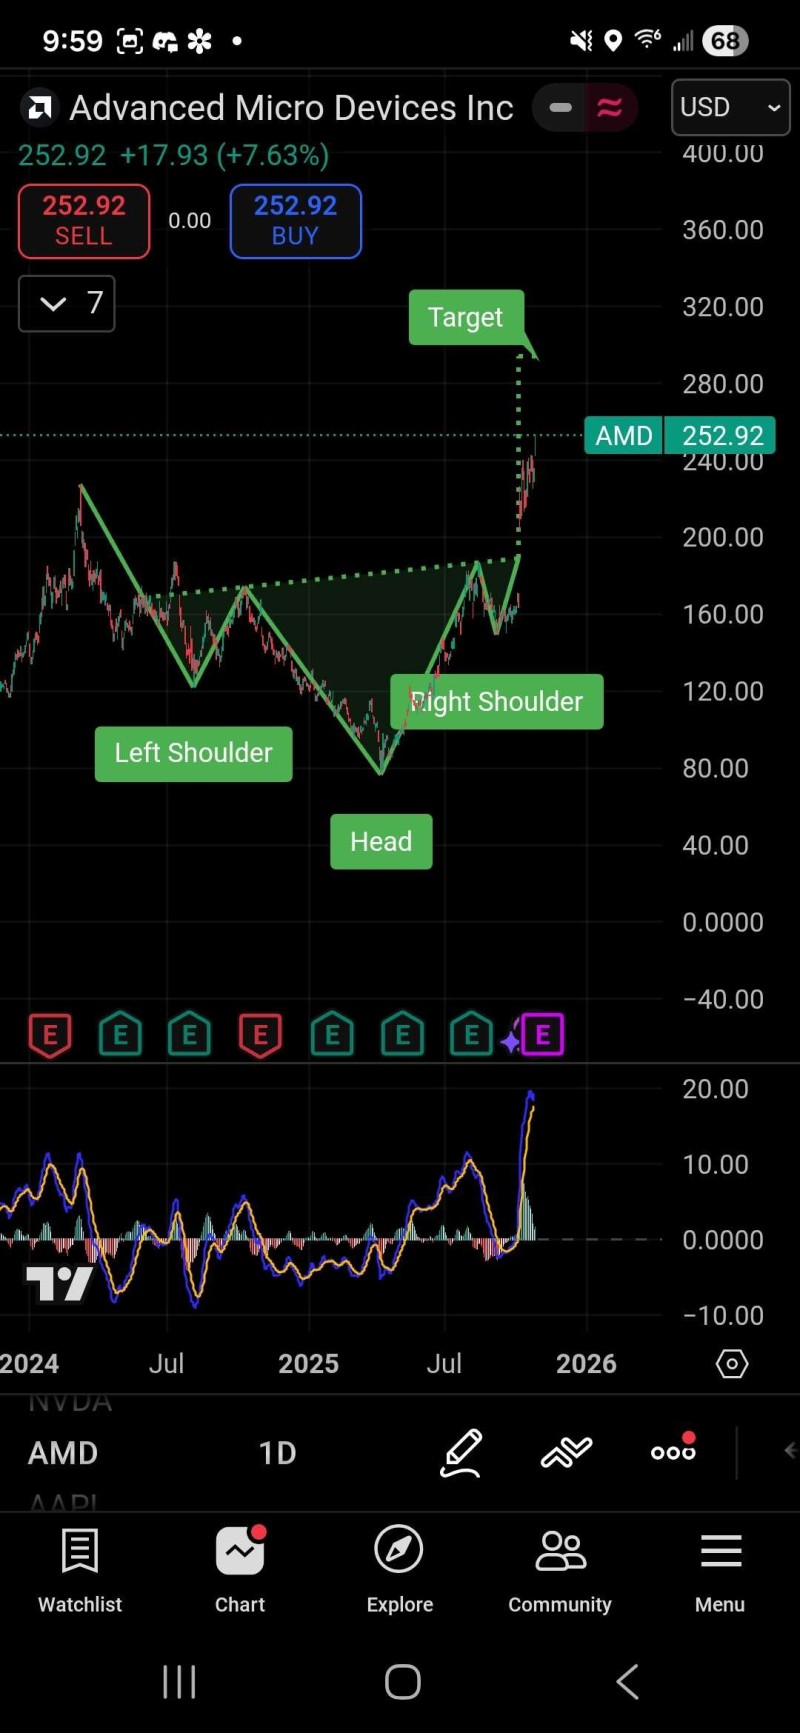
The semiconductor space is heating up again, and AMD is stealing the spotlight. After a strong rally that pushed shares above $250, investors are closely tracking a textbook inverse head-and-shoulders formation—a chart pattern that's historically signaled major bullish reversals.
Adding fuel to the fire, recent reports suggest AMD's newest processors can work around vulnerabilities found in competing chips, boosting market confidence even further. With technical momentum building and positive news flow converging, AMD looks positioned to test resistance levels that could unlock fresh highs in 2025.
Classic Bullish Pattern Takes Shape
The price chart shows a clear inverse head-and-shoulders structure—a reliable reversal setup that often marks the end of extended consolidation periods. Here's how it unfolded: the left shoulder formed around $130, the head dipped to the $90–$100 zone (the pattern's lowest point), and the right shoulder developed near $160–$170 before breaking above the neckline around $200.
After that breakout, AMD jumped to roughly $252.92—a 7.6% single-day gain. The measured target from the neckline now points toward the $280–$300 range, matching the bullish forecast shared by traders like Xtrades Analysts Team. The chart's green trajectory clearly highlights this target zone, suggesting technical traders see more room to run before hitting serious resistance.
What's Driving the Momentum
The bullish case goes beyond just chart patterns. AMD's latest chips reportedly address hardware flaws that have affected other manufacturers' processors—a potential game-changer that could boost AMD's footprint in enterprise, AI, and data center markets.
With the AI hardware boom in full swing, AMD is emerging as a serious alternative to NVIDIA for high-performance computing. As demand for AI-ready GPUs and CPUs keeps climbing, AMD's tech roadmap supports the idea that this rally has legs.
Momentum indicators back up the bullish picture too. The MACD lines show a sharp upward crossover, signaling accelerating buying pressure and strong institutional interest. As long as AMD stays above $240–$245, the uptrend looks solid. Next resistance zones sit near $270 and $300—the latter being both a psychological milestone and a key technical level.
That said, if the stock slips below $220, it might retest support before continuing higher—a normal breather within a longer-term bullish cycle.
 Artem Voloskovets


