 Saad Ullah
⬤ AMD has stabilized above a major technical threshold this week, trading around $217 following a strong bounce. Market focus has shifted to the $198.61 support zone, which lines up with a key Fibonacci extension on the long-term chart. While some traders expect a gap fill scenario, the technical setup doesn't support that view as long as the $198.61 level holds firm.
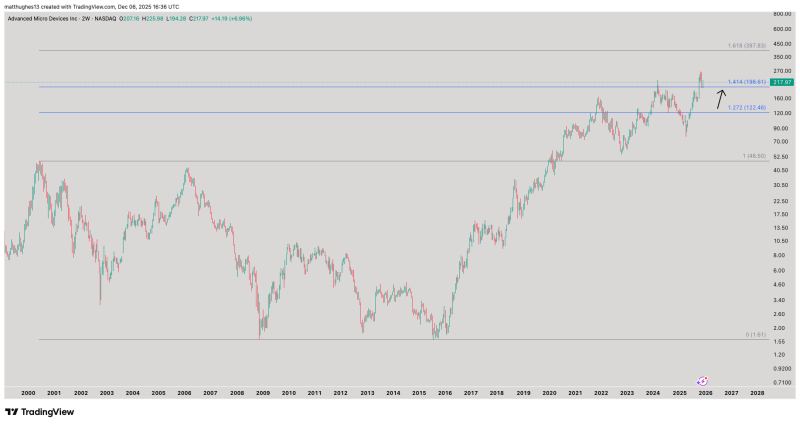
⬤ The chart reveals AMD in a sustained multi-year uptrend, backed by a clear pattern of higher highs and higher lows stretching back nearly ten years. After recently retesting the 1.414 Fibonacci level at $198.61, the stock bounced higher. Similar Fibonacci clusters in the past led to continuation patterns, and the current structure mirrors that behavior. If bullish momentum picks up again, the chart suggests a potential path toward the 1.618 extension near $397.83.
⬤ Over the last two years, AMD has consistently bounced back from pullbacks that brought prices near longer-term support zones. The latest weekly pattern shows buyers returning above support, reinforcing the idea that the broader uptrend remains solid despite short-term volatility and speculation about a deeper pullback.
⬤ This development matters for the broader market because AMD is among the most influential semiconductor stocks and serves as a key indicator of sector strength. If AMD continues above major technical levels and pushes toward higher Fibonacci targets, it could lift sentiment across chipmakers and growth-focused tech stocks. Strong performance from AMD would also validate the durability of long-term semiconductor trends.
 Saad Ullah


