 Peter Smith

⬤ Amazon stock is trading around $228 after pulling back from November highs, holding steady above short-term moving averages while testing a descending trendline. The price has found support and is attempting to rebuild momentum after establishing a base near recent lows.
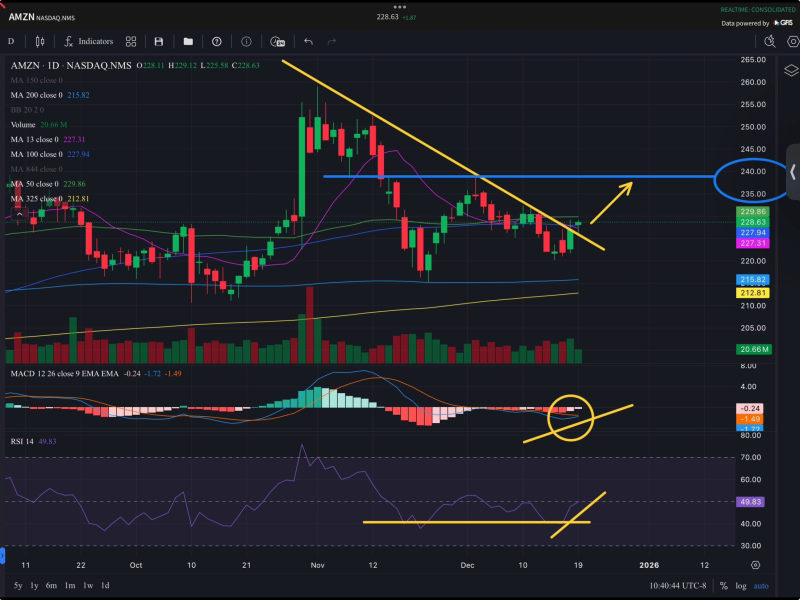
⬤ The technical picture shows early stabilization signs rather than a full trend reversal. The stock has reclaimed its 13-day exponential moving average but still sits below the 200-day moving average near $216. Trading volume remains moderate, indicating steady participation without aggressive buying or selling. A notable volume shelf appears near $238, matching a previous consolidation area and horizontal resistance level.
Amazon sits at an inflection point between trend continuation and trend reversal.
⬤ Momentum signals are improving gradually. The daily MACD is moving toward a potential bullish crossover, while the RSI has formed a double-bottom pattern and is climbing from below 40 toward neutral territory. These indicators suggest weakening downside pressure, though they don't confirm a sustained upward move yet.
⬤ This setup matters because Amazon is at a critical technical juncture. Breaking above the descending trendline and the $238 resistance would shift the near-term outlook positive, while failing to hold current levels could mean more sideways action. As momentum stabilizes and price compresses near resistance, Amazon's next move could influence sentiment across large-cap tech stocks.
 Peter Smith


