 Artem Voloskovets

⬤ Apple shares are showing signs of a potential short-term directional shift after climbing steadily on the daily chart. The TD Sequential indicator has printed a "9" — a widely-watched signal that often appears when momentum from a sustained move may be nearing an inflection point.
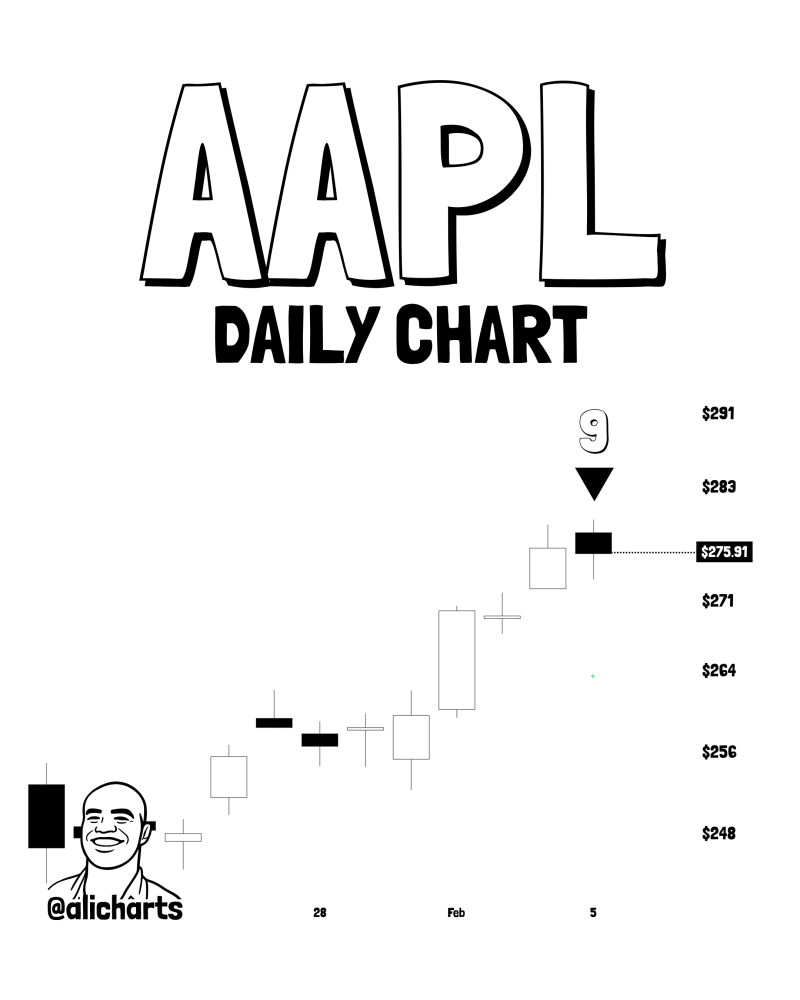
⬤ The AAPL chart reveals price advancing from the $248–$256 range toward the mid-$270s before the signal emerged. The most recent candle sits near $275, positioned below nearby resistance zones around $283 and $291. The sequence count appears after several consecutive higher sessions, suggesting momentum may be entering a pause rather than confirming further continuation.
⬤ TD Sequential signals function as timing alerts rather than directional predictions. While AAPL hasn't confirmed a reversal or continuation yet, the indicator highlights an area where traders typically watch for reaction. How price behaves around these upper levels will determine whether the move shifts into consolidation or resumes its trend.
⬤ Given Apple's significant weight in major equity indexes, any rotation in AAPL can ripple across broader market sentiment. Signals appearing at elevated price levels often coincide with momentum shifts in the technology sector, making the reaction near current levels a key reference point for overall market direction.
 Artem Voloskovets


