 Marina Lyubimova

⬤ SPY caught a strong bid after hitting a well-defined demand zone between $679-$683, proving buyers are still showing up at the right spots. This bounce let traders move their long positions into lower-risk territory.
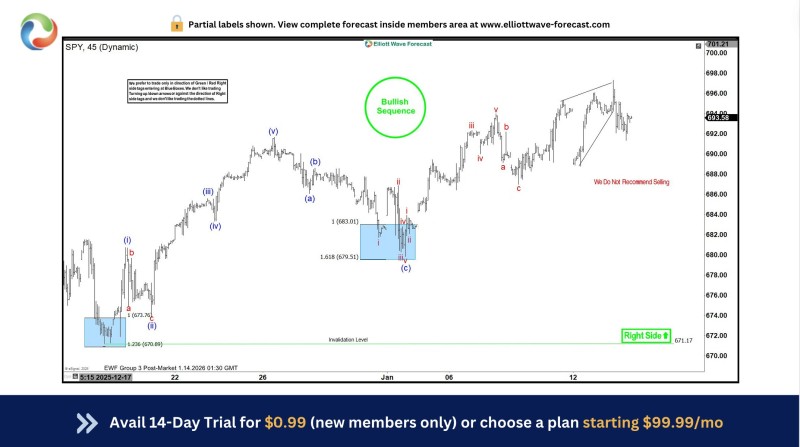
⬤ The chart's showing a clean Elliott Wave pattern with higher highs and higher lows still intact. That support area lined up perfectly with Fibonacci levels, and once price hit that blue box zone, it ripped higher—exactly what you want to see when demand kicks in.
⬤ Price action stayed bullish after the bounce, pushing back toward recent highs. The pullbacks look corrective, not like the trend's falling apart. As long as SPY holds above the $671 invalidation level, there's no reason to bet against it right now.
⬤ This matters beyond just SPY—it's basically a snapshot of how the whole market's feeling. When the S&P 500 ETF holds technical support and keeps climbing within its structure, it sets the tone for U.S. equities overall and keeps risk appetite steady.
 Marina Lyubimova


