Saad Ullah

⬤ Looking at S&P 500 returns from 1928 through 2025 gives us a clear picture of how this year stacks up against almost 100 years of market data. The distribution breaks down each year into different return ranges—from major losses to gains above 40 percent. Right now, the S&P 500 is up roughly 16 percent in 2025, which puts it squarely in the 10 to 20 percent gain zone. This range happens to be one of the most frequently seen outcomes in the index's entire history.
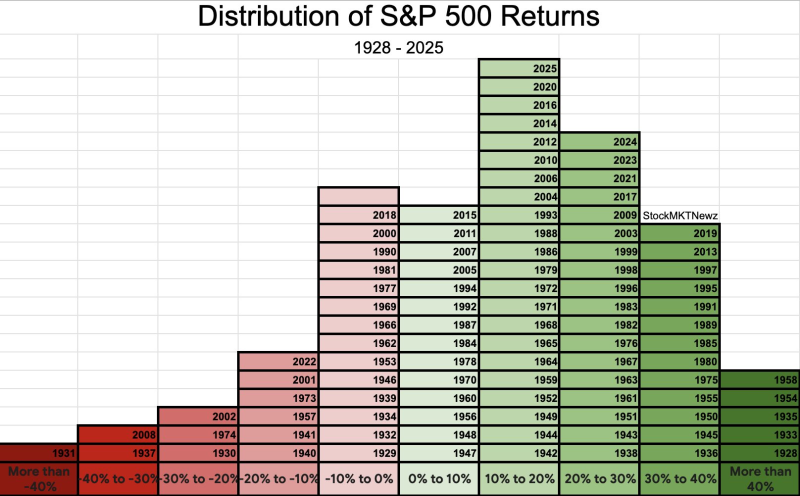
⬤ The numbers tell an interesting story: most years have been positive for the S&P 500, with the biggest cluster falling between 0 and 20 percent gains. Years delivering 10 to 20 percent returns show up particularly often, capturing those steady growth phases that happen across different economic cycles. Bigger years with 20 to 30 percent or even 30 to 40 percent gains don't happen as much, but they're a regular part of post-recession bouncebacks and strong momentum periods.
⬤ When it comes to losses, the data shows they're actually pretty rare by comparison. Years dropping more than 30 percent are limited to handful of crisis moments like the Great Depression and 2008 financial meltdown. Moderate declines between 10 and 20 percent happen more regularly but still far less than positive years. This lopsided pattern confirms the S&P 500's long-term upward tendency over the decades.
⬤ A mid-teens gain isn't some unusual event—it's one of the most typical annual profiles you'll find across nearly a century of market data. Understanding where we sit in this historical distribution helps explain why steady positive years keep showing up, even when volatility and uncertainty are part of the picture.
 Saad Ullah