 Peter Smith

Analyst Elif Nur Sarıyel flags a technically sensitive setup forming in the S&P 500, where price is pressing into the upper wall of a rising channel with the weekly structure turning negative and downside risk growing. The index has pushed toward the 6,600-6,700 region, printing a recent high near 6,684, a zone that has historically acted as resistance within the channel.
The Rising Channel Defining S&P 500 Price Action
The chart shows a clean ascending structure, with the S&P 500 forming higher highs and higher lows over time. Price has consistently respected both boundaries, reinforcing the channel as the dominant technical framework guiding the market.
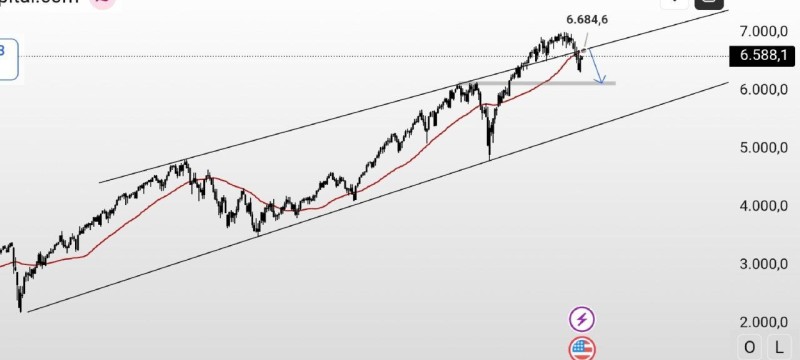
The red moving average continues to track beneath price, acting as dynamic support during the climb. This alignment reflects a still-active upward structure, but one that is approaching exhaustion at the top boundary. As the upper trendline comes back into play, the retest carries added weight given how cleanly the index has respected this level in previous cycles.
S&P 500 Has 50-100 Points Left Before Resistance Fully Engages
The key detail from the chart is how little room remains before price fully engages the upper resistance zone. Rather than signaling a breakout, this positioning reflects a late-stage move within the channel. Similar setups have historically resulted in rejection from the upper boundary, particularly when price approaches it after an extended advance.
SPY reacting precisely at technical zones has been a recurring pattern, and the current setup fits that same playbook. The structure suggests only an additional 50-100 points of upside before the retest completes, with the projected move on the chart then pointing toward a pullback into the lower part of the range near the 6,000 zone.
S&P 500 Structure Shows Signs of a Transition Point
What stands out is the contrast between the intact upward channel and the negative tone highlighted in the weekly view. The market is still trending higher, but the setup near the top boundary marks the kind of transition point where momentum typically begins to fade.
Analysis of fragile structure developing near resistance in SPY stock reinforces this read, where repeated failures to extend higher have begun shaping downside risk. The current S&P 500 positioning fits that broader pattern, where structure rather than momentum dictates behavior.
- The S&P 500 remains inside a rising channel
- Price is testing the upper boundary near recent highs
- Only a limited 50-100 point move higher is implied before resistance fully engages
- The chart anticipates a potential move lower following the retest
This type of setup, where price retests a channel top after a sustained move, often marks a transition point where momentum begins to fade.
How repeated resistance tests weaken market structure is well-documented across asset classes, and the S&P 500 channel top fits that pattern precisely. When momentum stalls near defined boundaries, the structure itself begins to shift toward consolidation or decline.
 Peter Smith


