 Saad Ullah

⬤ The S&P 500 is tracking a pattern seen repeatedly during geopolitical shocks. Historical data shows equities typically drop around 6% to 8%, hit a bottom within roughly three weeks, then recover over a similar window. The current selloff lines up with both the scale and timing of those past troughs.
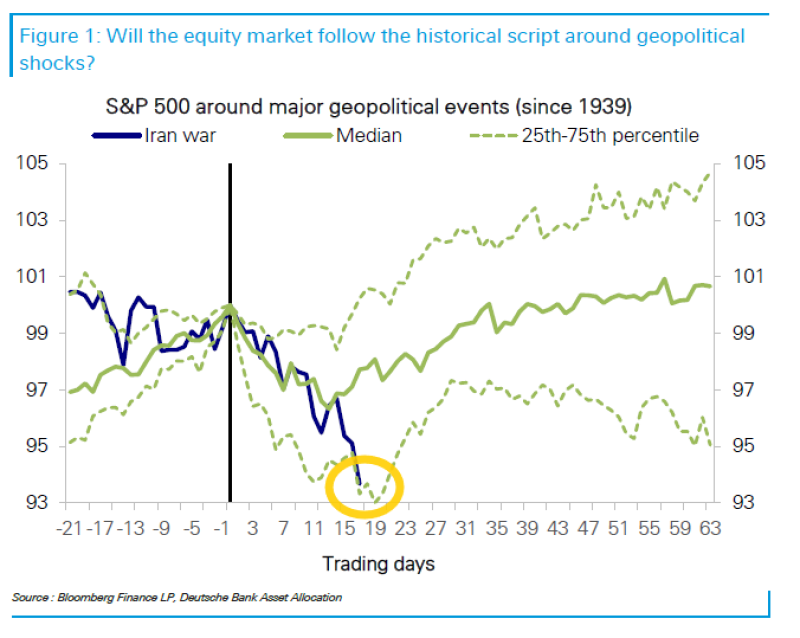
⬤ A chart comparing S&P 500 performance across major geopolitical events since 1939 shows a median trajectory with a 25th-to-75th percentile range. Markets tend to decline into the event window and reach a trough around 15 to 20 trading days after the initial shock. Current price action sits squarely within that historical band, pointing to a possible stabilization zone ahead.
⬤ The analysis highlights a tight link between equities and oil markets during geopolitical stress. Energy price volatility is acting as a key driver of risk sentiment right now. When oil volatility starts pulling back from extreme levels, it tends to signal that escalation risk is getting priced in. That same dynamic played out during the period covered in S&P 500 Slides as Iran War Raises 35% Market Meltdown Risk, where geopolitical headlines hit equities hard.
⬤ Sharp energy moves have added to the pressure across global markets. WTI Oil Hits $114: Geopolitical Risks Trigger Biggest Surge Since 2022 and Oil and Commodities Surge 20% After Middle East Escalation: Brent and Gold Rally both showed how oil spikes coincide with elevated volatility across asset classes, amplifying equity drawdowns.
⬤ The overlap between today's S&P 500 action and historical geopolitical cycles points to a market that tends to follow repeatable paths through uncertainty. Risks remain real, but history suggests equities stabilize and begin recovering before a crisis fully resolves - a reflection of how forward-looking markets respond to shifts in volatility and macro conditions.
 Saad Ullah


