 Usman Salis
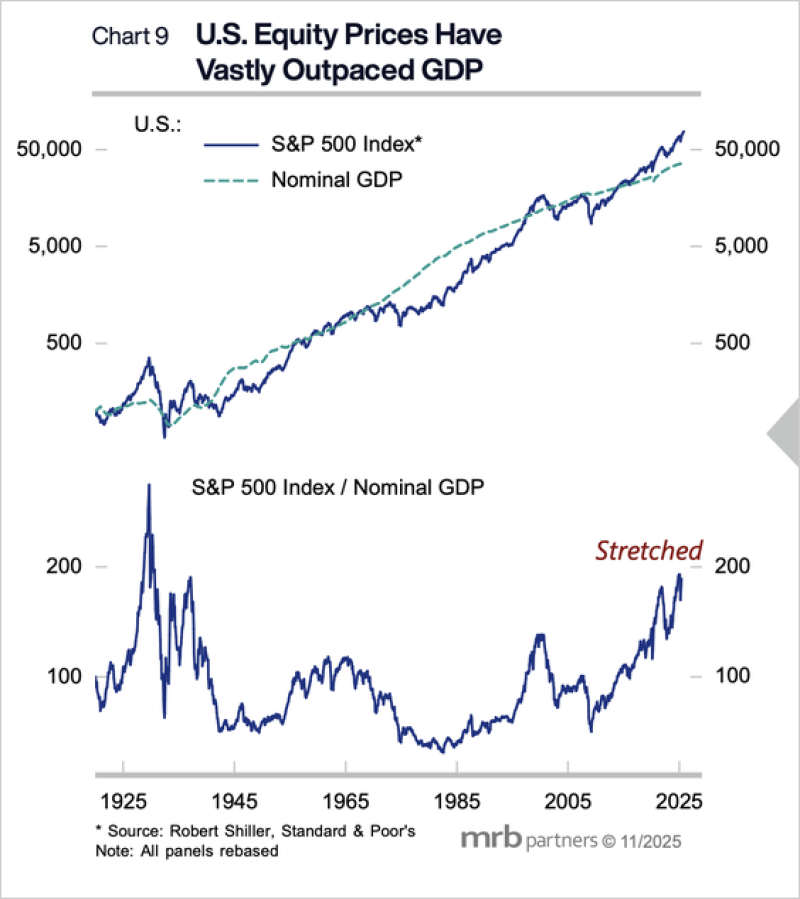
⬤ U.S. stock prices have climbed way faster than GDP, creating a growing gap between what companies are worth on paper and the actual economic activity generating their revenues. Charts comparing the S&P 500 to nominal GDP show equities pulling ahead sharply in recent years. The ratio between the two now sits at levels labeled "stretched" — among the highest recorded in nearly a century.
⬤ Policy risks are mounting as discussions around potential tax increases could hit already-pricey stocks. Higher capital gains or corporate taxes would squeeze companies relying on equity compensation and elevated valuations. This might push capital elsewhere, drive talent away as rewards shrink, and in weaker sectors, increase the chance of restructuring or failures. With valuations already extended relative to GDP, tighter policy could magnify downside risk.
⬤ Market observers note that corporate earnings can't sustainably outgrow the broader economy forever. History shows similar valuation extremes have typically led to flat returns or corrections as markets realign with economic reality. Looking at data from the 1920s through 2025, every major split between stock prices and GDP has eventually closed.
⬤ The big question for investors: can this last? With GDP growth slowing while stock valuations stay near historic highs, markets may lean more on liquidity and sentiment than actual earnings power. Since company revenues ultimately tie back to GDP, the widening gap suggests underlying fragility despite strong headline numbers. This disconnect has become one of the key market indicators worth watching closely.
 Usman Salis


