 Saad Ullah
Bloomberg data shows that over one billion barrels of crude are currently sitting on tankers worldwide - a record not seen since the 2020 demand collapse. This massive buildup coincides with oil futures falling to around $60 a barrel, their lowest level in five months.
Global Oil Supply: A Floating Surplus Builds
The surge in offshore storage shows how quickly supply has outpaced demand. Analyst James E. Thorne notes that crude and gasoline are key forward indicators of inflation, and this floating surplus could mark the beginning of a broader disinflationary trend. Over 1 billion barrels are now aboard the global tanker fleet, while crude shipments from the Middle East are reportedly going unsold as refiners cut intake. Futures near $60 a barrel suggest traders expect further weakness.
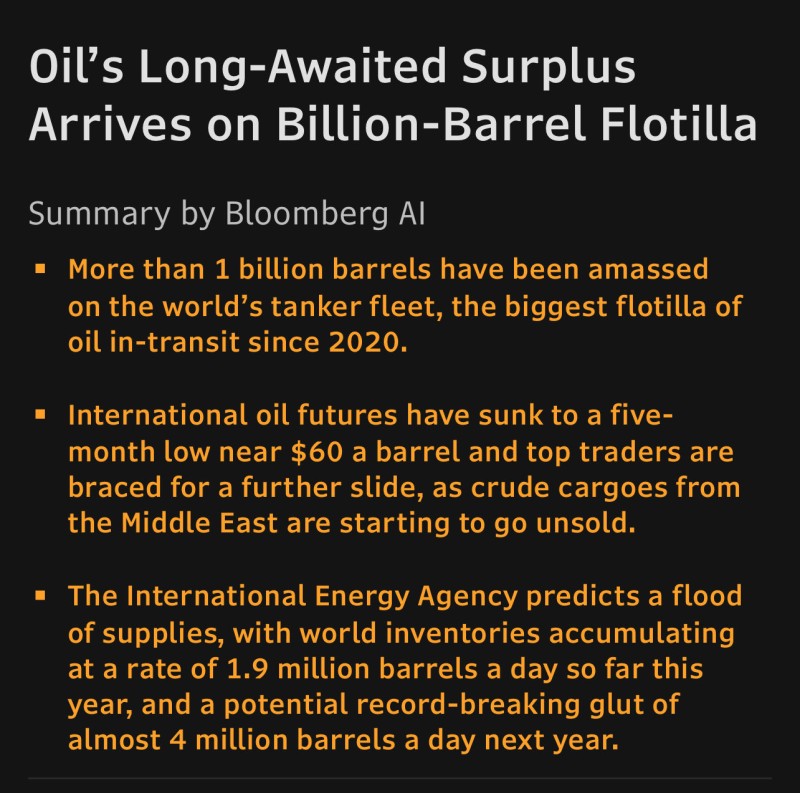
The International Energy Agency forecasts inventories are increasing at 1.9 million barrels per day this year and could approach 4 million barrels per day of surplus in 2026 if production remains elevated.
Chart Overview: Price Pressure and Technical Weakness
Oil prices have steadily declined from the $75–$80 range, breaching support around $63. Momentum indicators now show a clear downtrend, suggesting sellers remain in control. If prices fail to recover above $65–$68, crude could test the mid-$50s in the months ahead. Gasoline futures are following a similar pattern, signaling a slowdown in consumption heading into winter.
Inflation Outlook and Economic Implications
Oil prices historically act as leading indicators for inflation. The ongoing decline could ease inflation pressure across the U.S. and Europe as energy costs drop, giving central banks flexibility to cut interest rates sooner. However, oil-exporting nations may face fiscal strain if prices stay near $60 or below. Lower energy prices could also stimulate consumer spending and industrial activity in importing economies.
 Saad Ullah


