 Saad Ullah
EUR/USD finds itself at a make-or-break moment, trapped inside a rising wedge that's building serious pressure. These patterns usually spell trouble for bulls, but right now the technicals and fundamentals are telling a different story.
Technical Breakdown
As Forex Sinyal Merkezi pointed out, how the pair handles key support levels will likely determine where we're headed next.
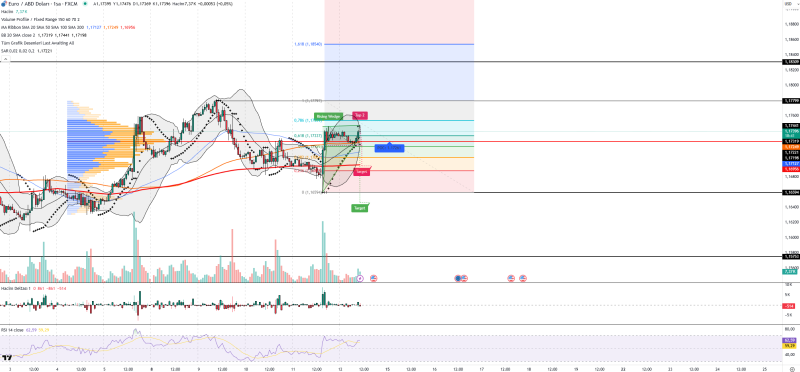
The hourly chart shows EUR/USD holding steady around 1.1739, sitting comfortably above the 200 MA - a clear sign that buyers aren't giving up yet. The pair is getting squeezed in the upper part of the wedge, which means we're probably due for some fireworks soon.
Key Indicator Readings:
- RSI at 62.6 shows solid momentum without being overextended
- Volume is picking up on the buy side, indicating genuine demand
- Price stays above the 1.1726 volume profile point of control
- Bollinger Bands are getting tested at the top, creating immediate resistance
- Parabolic SAR dots remain below price, confirming the upward bias
- Fibonacci support holds at 1.1733 with resistance waiting at 1.1779
The technical picture paints a story of cautious optimism. Bulls are still in charge, but they need to prove themselves at these higher levels.
Macro Forces at Play
The euro is catching some tailwinds from recent developments. The ECB kept rates steady while Lagarde struck a balanced tone about eurozone growth prospects. Meanwhile, US inflation ticked up to 2.9%, but rising jobless claims are keeping Fed rate cut hopes alive. This combination is creating a perfect storm for dollar weakness, and EUR/USD is riding that wave.
EUR/USD is sitting at a crossroads where every move matters. If buyers can hold above 1.1726, we could see a push toward 1.1779 and potentially higher. But if that support cracks and we break below 1.1712, the whole bullish setup falls apart and we're looking at a potential reversal. The rising wedge adds another layer of complexity - these patterns love to fake out traders before making their real move.
 Saad Ullah


