Usman Salis
EUR/USD is hanging by a thread as traders parse conflicting signals - ECB rate cut bets weighing on the euro while US jobs and inflation data loom over the dollar. The hourly chart is flashing warning signs with a textbook bearish reversal pattern forming right at a critical support zone.
What the Charts Are Showing
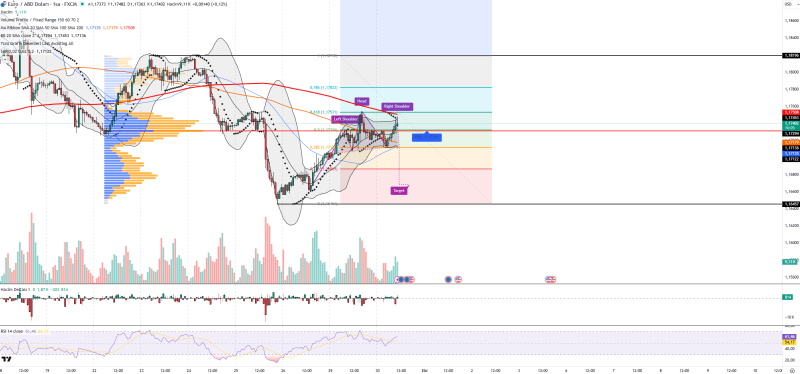
Forex Sinyal Merkezi highlighted the technical picture is pretty clear. A Head-and-Shoulders pattern has formed with the neckline sitting right at 1.1731, which also happens to be where most of the volume is concentrated. Price is stuck below the 200-period moving average, which isn't great for bulls. The Bollinger Bands are squeezing, suggesting a big move is coming soon. RSI is floating around 54-61, so momentum is neutral but trying to push higher. The Parabolic SAR dots are sitting under price, offering some short-term support, but that could flip fast.
Key Levels to Watch
- Support zones: 1.1731, 1.1713, and 1.1657
- Resistance zones: 1.1753, 1.1782, and 1.1819
If 1.1731 breaks, the pattern confirms and we're probably heading down to 1.1657. But if buyers can push back above 1.1782, the whole setup gets invalidated and we could see a run toward 1.1819.
The ECB is leaning toward cutting rates, which keeps pressure on the euro. Meanwhile, US jobs numbers and inflation prints are about to drop, and those will directly impact Fed policy and dollar strength. Risk sentiment keeps swinging, adding fuel to short-term volatility.
 Usman Salis