 Saad Ullah

⬤XRP/USDT is consolidating after an extended downtrend, with price holding within a clearly defined accumulation range between $1.20 and $1.35. This zone reflects a slowdown in selling pressure following months of consistent decline. The chart shows XRP shifting from lower highs and lower lows into a sideways structure, pointing to a possible base forming beneath the market.
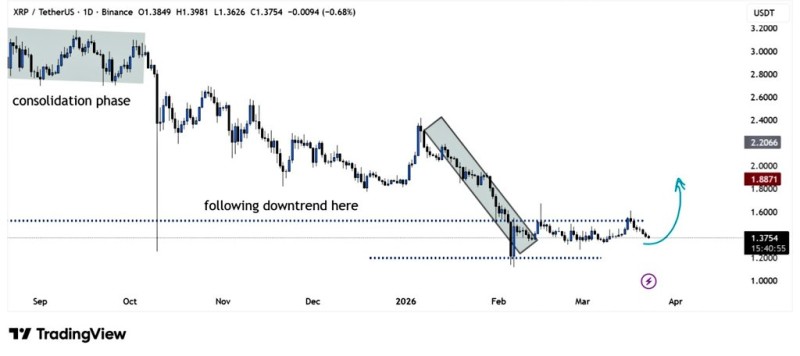
⬤The broader XRP price analysis confirms the asset broke out of a steady downtrend channel before entering its current consolidation phase. Price is holding above the lower support band near $1.20 while repeatedly testing the mid-range around $1.35. The $1.50 level stands out as a key resistance threshold, aligning with recent local highs and acting as the line between continued sideways movement and a shift in momentum.
⬤From a technical standpoint, a confirmed breakout above $1.50 could open the path toward $1.80, the next upside zone projected on the chart. However, failure to hold the $1.20-$1.35 accumulation range would weaken the current structure and push back any bullish recovery. This type of post-downtrend consolidation is consistent with patterns seen in XRP's broader market behavior, where price stabilization has preceded expansion phases.
⬤The current XRP price action reflects a market in equilibrium, with buyers and sellers testing control inside a narrow range. The balance between support at $1.20-$1.35 and resistance at $1.50 defines the near-term structure. As noted in the XRP price forecast, similar sideways consolidation phases have historically preceded larger directional moves in either direction.
 Saad Ullah


