 Usman Salis
⬤ XRP is catching traders' eyes as new chart comparisons reveal striking similarities between today's price action and the 2016-2017 formation. The analysis maps out both periods using numbered phases 1 through 4, showing how the current cycle is tracking the same rhythm and movements that preceded one of crypto's most explosive rallies.
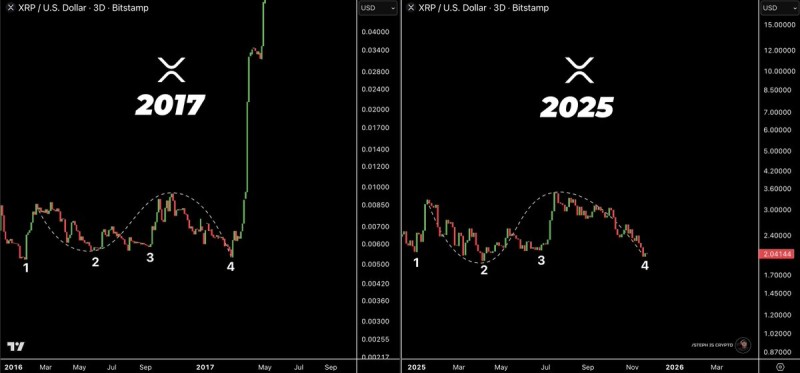
⬤ Back in 2017, XRP completed four distinct waves before launching into a massive breakout. Now trading around $2.04, XRP appears to be sitting at the same critical point 4 position where the previous surge began. Each corrective swing and recovery phase lines up almost perfectly with the earlier cycle, creating a nearly identical visual pattern that's hard to ignore.
⬤ The comparison doesn't predict specific price targets but focuses purely on the structural repetition between the two periods. If history repeats itself, XRP could be approaching a pivotal moment, since the 2017 pattern transitioned from consolidation to a dramatic vertical move right after completing this same phase.
⬤ Why does this matter? XRP has a track record of sharp cyclical movements, and when patterns repeat this closely, it tends to shift market sentiment fast. The visual alignment has reignited conversations about whether XRP is setting up for another major phase, giving traders a historical blueprint to watch as the current structure continues to develop.
 Usman Salis


