 Usman Salis
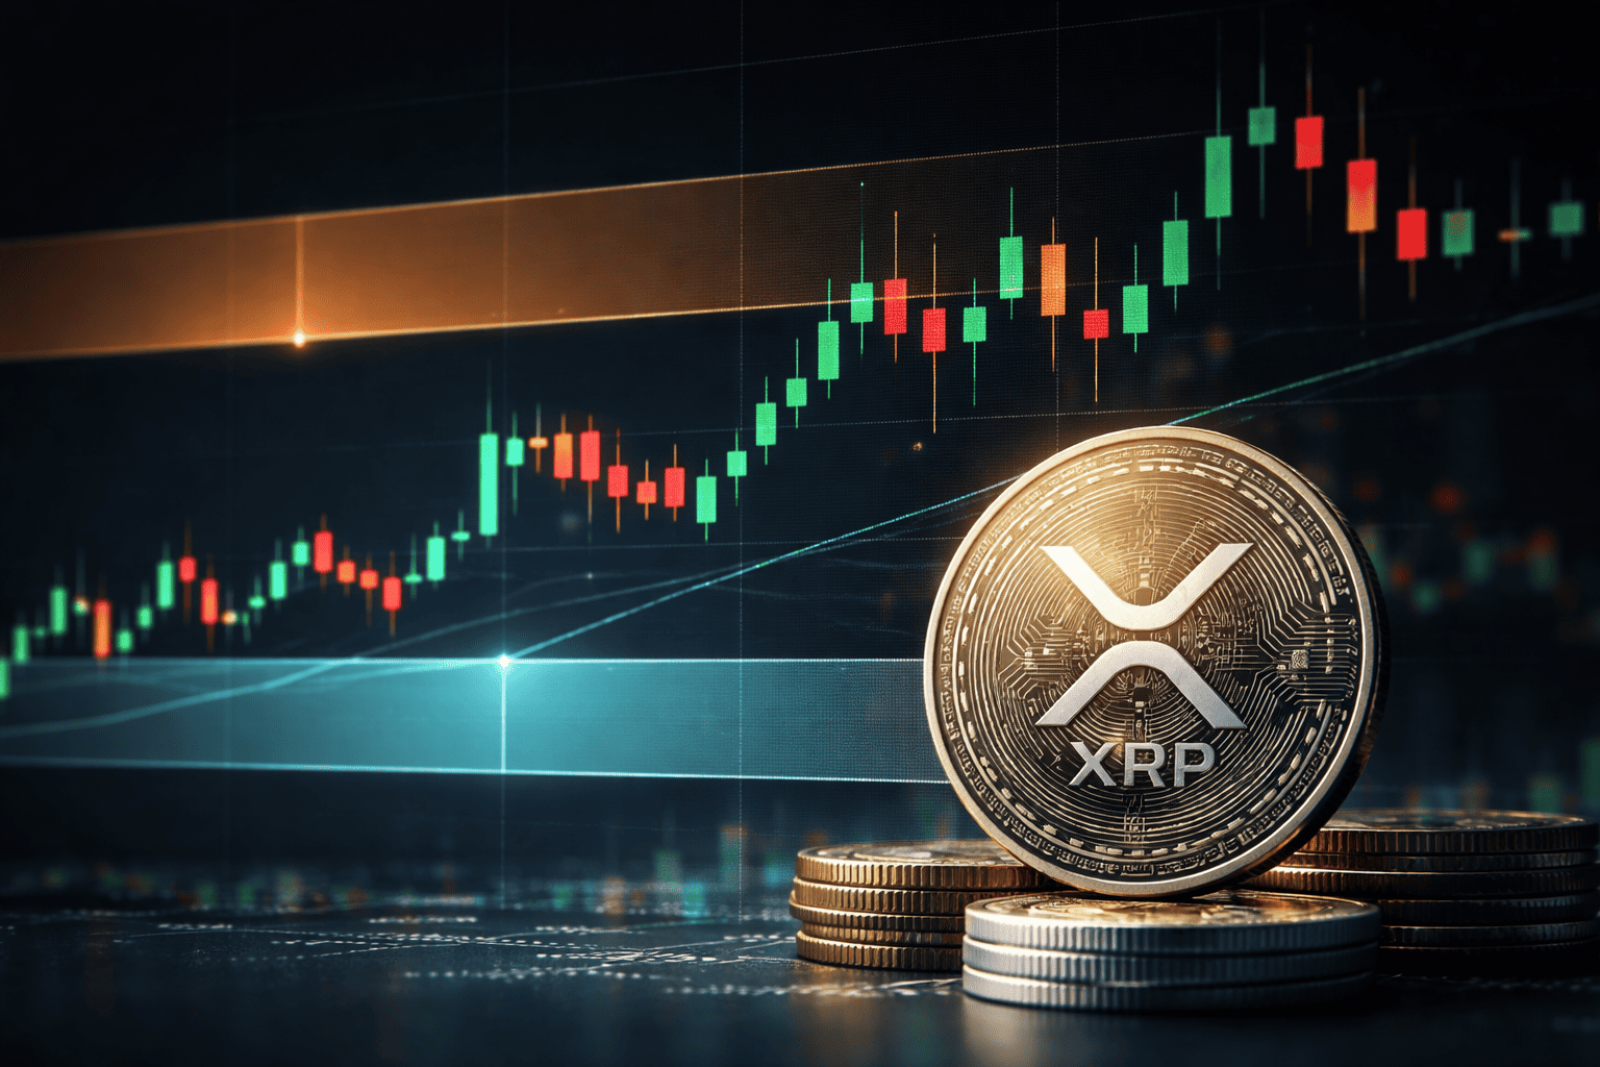
⬤ XRP is hovering around a crucial technical zone, repeatedly testing deeper liquidity pockets. The current price sits close to notable wick levels from October and April, suggesting concentrated liquidity in this area. After peaking at its all-time high, XRP has moved through several bearish patterns and corrective phases, now trading in a range that coincides with previous liquidation points.
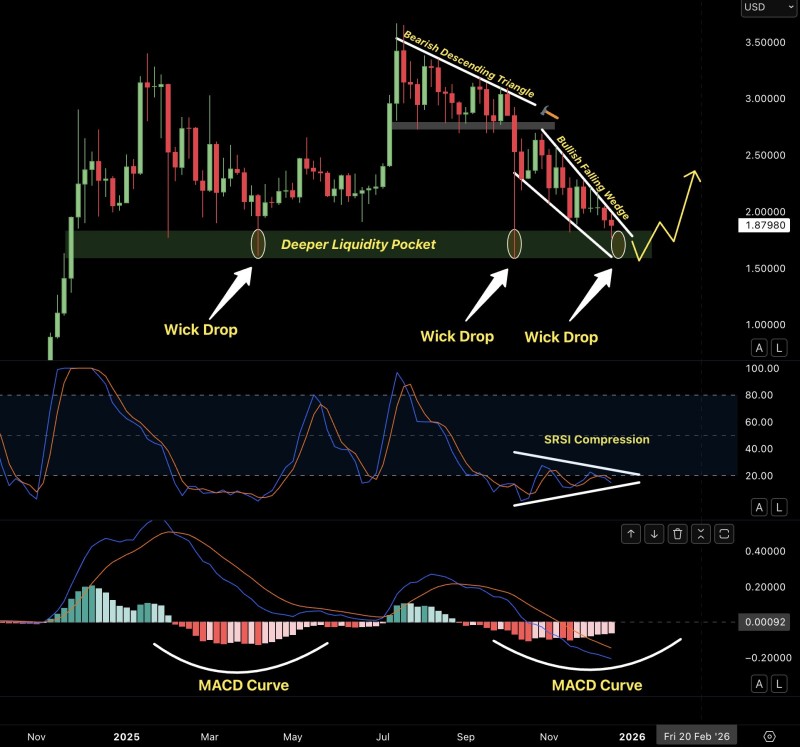
⬤ The chart reveals distinct stages in XRP's decline. Following its top, price formed a descending triangle before a sharp October liquidation. This led to a retest of former support-turned-resistance before shifting into a falling wedge pattern. The wedge has guided price lower in a controlled way, with multiple wick drops into the liquidity band—indicating repeated sweeps rather than sustained moves.
⬤ Momentum indicators show compression building. The MACD has flattened after extended negative territory, showing weakening downside without confirming reversal. Meanwhile, the stochastic RSI sits compressed near its lower range, matching reduced volatility. These signals align with tightening price action within the falling wedge around marked liquidity zones.
⬤ XRP's recent behavior underscores the importance of liquidity sweeps and structural consolidation after major moves. The combination of repeated wick drops, momentum compression, and narrowing price structure indicates a positioning phase. How XRP resolves this compression—whether continuing to sweep liquidity or stabilizing within current ranges—will be crucial for broader market sentiment.
 Usman Salis


