 Usman Salis

⬤ XRP dropped to around $2.1775 on the 4-hour chart, reflecting a 2.70% decline as the asset nears its recent low of $2.1733. Selling pressure is picking up, and sentiment around the ongoing weakness remains a focus for short-term traders.
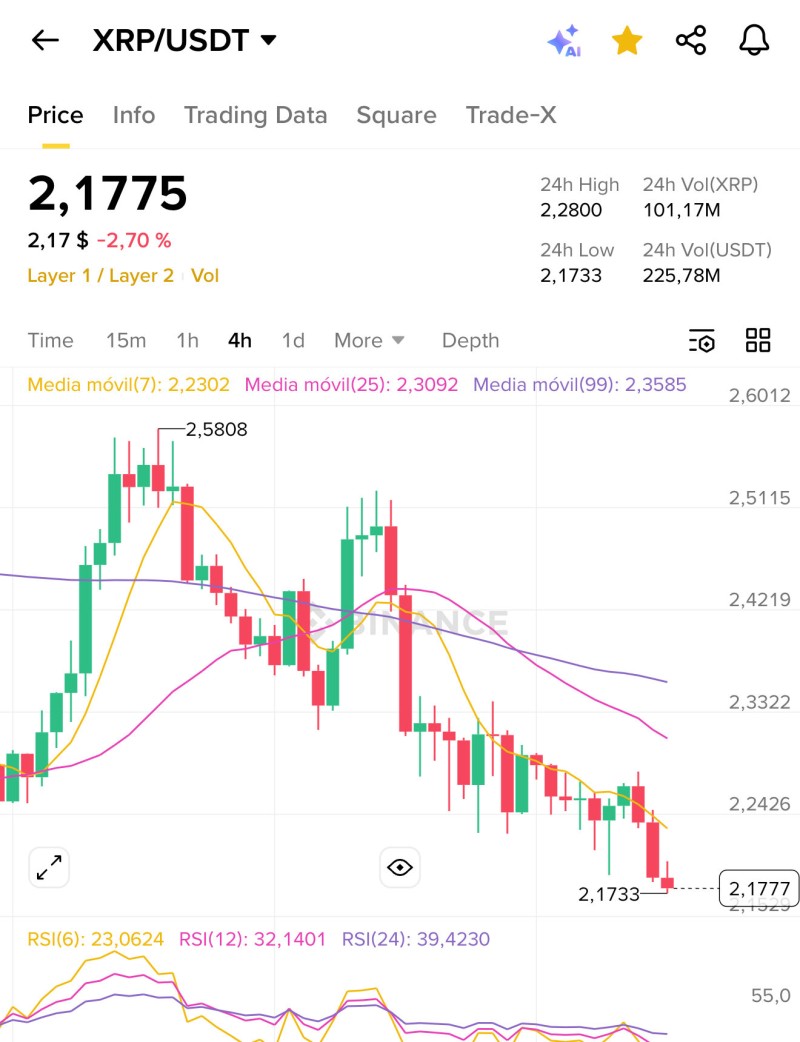
⬤ The chart shows XRP stuck in a steady downtrend, with recent candles signaling consistent selling momentum. The recent high of $2.28 marks the top of the current move, while the slide toward lower levels shows little upward traction. Moving averages are stacked above price—the 7-period sits near $2.23, the 25-period around $2.31, and the 99-period near $2.36—all pointing to a bearish setup that keeps XRP below key technical levels.
⬤ Momentum indicators confirm weakening buying strength. The RSI(6) reading of 23.06 signals oversold conditions in the short term, while RSI(12) at 32.14 and RSI(24) at 39.42 show broader momentum remains weak. Any bounce attempts have been quickly met with fresh selling, preventing XRP from stabilizing or reversing its short-term direction.
⬤ XRP's movement around $2.17 matters because it reflects shifting sentiment in a market where liquidity and short-term signals drive price action. The repeated testing of local lows shows how fast momentum can flip, shaping volatility patterns and influencing broader dynamics across major digital assets.
 Usman Salis


